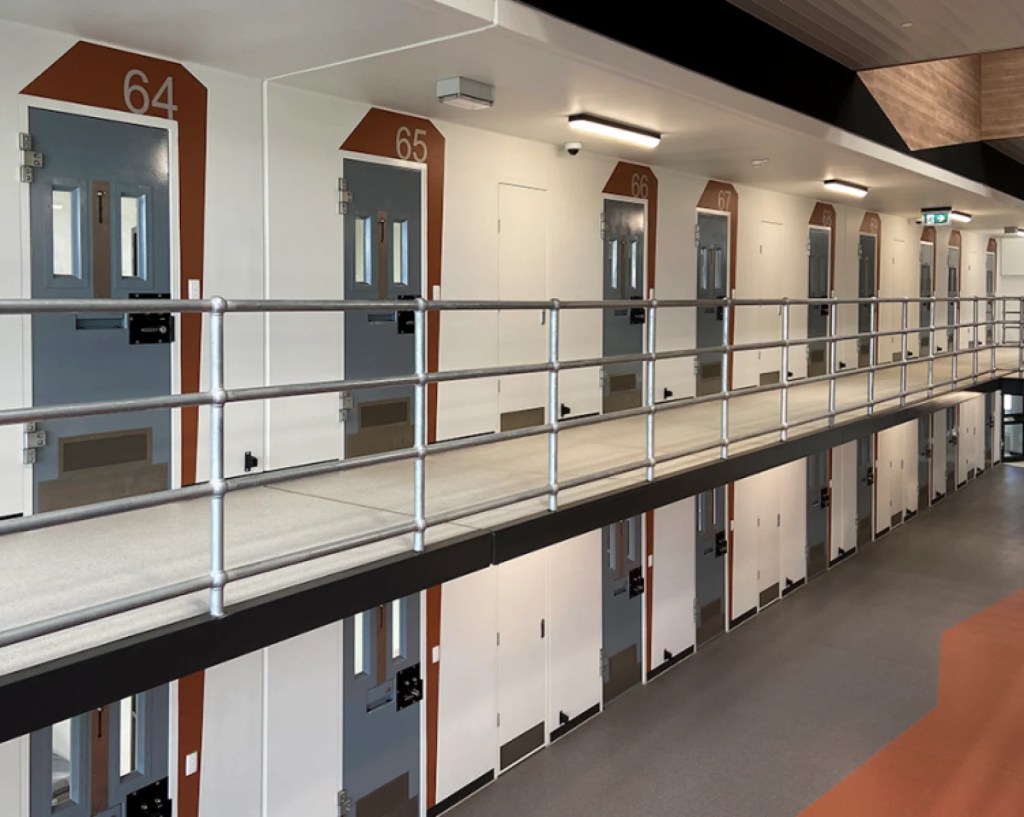
The Status Quo is Fiscal and Social Failure.
Victoria’s current “tough on crime” legislative framework compromises public safety, drives government waste, and fails the community. Decades of punitive policy mandates—most notably the “tough on bail” reforms of the 2010s—have doubled Victoria’s prison population, inflated private sector profits, and locked the state into a costly “recidivism trap.”
With national prison spending exceeding $6.8 billion annually and more than 50% of individuals returning to custody within two years, the 50-year prison expansion model has collapsed.
We must pivot from an expensive system of containment to an evidence-based model of diversion, targeted rehabilitation, and community reinvestment.
Parliament has no excuses left to delay action. The blueprints for a safer, more fiscally responsible Victoria already exist in numerous parliamentary inquiries, sector recommendations, and Indigenous-led reform proposals. Failing to implement these reforms is an active endorsement of government waste. I stand for a justice system that prioritizes community safety, fiscal responsibility, and human rehabilitation over corporate prison profits.
1. End Fiscal Waste and the “Recidivism Trap”
Building more prisons does not reduce crime. Victoria currently leads the nation in per-capita infrastructure spending, anchored by underutilized facilities like Western Plains.
- The Fiscal Burden: Every recidivist prisoner costs Victorian taxpayers approximately $219,000 per year in direct correctional costs, court appearances, and police hours.
- The Reinvestment Solution: I advocate shifting capital allocation away from “new beds” and directly into employment readiness and community-led programs.
2. Overhaul the Remand Crisis
Victoria suffers from the highest proportion of unsentenced prisoners in Australia. Nearly 45% of people in Victorian cells have not been convicted of a crime, significantly higher than New South Wales and Queensland (35–38%).
- The Rehabilitation Barrier: Remand prisoners exist in a state of legal limbo, making them ineligible for Victoria’s robust correctional programs.
- The Policy Pivot: We must reform bail laws to safely reduce the remand population. This ensures individuals are not held in “legal limbo” only to be released at sentencing with zero transition support.
3. Implement Evidence-Based Rehabilitation
Modern, effective justice policy must be guided by data, not knee-jerk political rhetoric. I endorse a two-pronged rehabilitation framework:
- Risk-Needs-Responsivity (RNR): Rehabilitation must be heavily targeted. I support intensive programs for high-risk offenders while leaving low-risk offenders separate to avoid behavioral “contamination”.
- Through-Care: Rehabilitation cannot stop at the prison gate. I support a comprehensive “Through-Care” model where structured rehabilitation begins inside the cell and extends for 12 months post-release.
- Short-Sentence Inclusion: We must expand intensive rehab access to those serving sentences under 6 months (such as minor theft or driving offenses), as this cohort currently retains the highest risk of reoffending.
4. Transition to Community-Led Justice Reinvestment
Prisons treat the symptoms of systemic failure rather than the root causes.
- The Strategy: Following successful frameworks in New South Wales and the ACT, Victoria must adopt Justice Reinvestment. This strategy diverts funds away from physical prisons and reinvests them into community-led programs in high-crime postcodes to stop crime before it occurs.
5. Reduce the Hybrid Management Burden
Victoria’s hybrid public-private prison model (including facilities like Port Phillip and Ravenhall) creates an expensive administrative duplicate.
- The Cost: The state spends $159 million annually on central Department of Justice (DoJ) staff, primarily to employ hundreds of Contract Monitors and Compliance Officers to oversee private operators.
- The Strategy: I support streamlined public oversight, strict enforcement of private performance targets, and a long-term review into the cost-efficiency of private operations versus public management.
Google backgrounder
Over the last 50 years, Australia’s corrective services have shifted from a “rehabilitative” model in the 1970s to a “tough on crime” punitive era in the 1990s, and finally to the current infrastructure crisis of 2026. National prisoner numbers have more than quadrupled since 1980, far outpacing general population growth.
National Incarceration Rate (1976–2026)
Figures represent the number of prisoners per 100,000 adults. [1, 2]
- 1976: ~60 per 100,000
- 1996: ~115 per 100,000
- 2016: ~208 per 100,000
- 2026: ~225 per 100,000 (Estimate)
State-by-State 50-Year Trends
Northern Territory (The Outlier)
The NT has seen the most dramatic climb in the nation. Since the mid-1990s, the introduction of mandatory sentencing and tougher bail laws has pushed their rate to nearly 5 times the national average.
- 1970s: Rates were comparable to the rest of the country.
- 2026: Currently detains over 1,000 per 100,000 adults, largely driven by the over-representation of Indigenous Australians (who make up over 80% of the NT prison population).
New South Wales (The Infrastructure Leader)
NSW led the “Prison Boom” of the 2010s, building massive facilities like Clarence Correctional Centre.
- Trend: Shifted from aging urban gaols to massive, privately-operated regional “mega-prisons.”
- Outcome: NSW now has the largest total prisoner population, though its growth rate has stabilized in 2026 as the state focuses on “intensive community orders” to reduce costs.
Victoria (The Rapid Climber)
Historically a low-incarceration state, Victoria saw a massive surge following the 2010s “tough on bail” reforms.
- Trend: The prison population doubled between 2008 and 2018.
- 2026 Status: Victoria currently spends the most per capita on prison infrastructure, with the new Western Plains facility serving as a primary cost driver despite being underutilized for years.
Queensland (The Capacity Crisis)
QLD has focused on high-capacity, low-cost-per-day warehousing of prisoners.
- Trend: Persistent overcrowding has been a 50-year theme.
- 2026 Status: To manage costs, QLD has the lowest daily spend per prisoner (~$369) but faces the highest rates of “doubling up” (two prisoners per cell).
The Rise of Privatisation
Starting in the 1990s, Australia became one of the most privatised prison systems in the world per capita. [3]
- NSW & QLD: Lead the way in private management (e.g., Serco, G4S). Approximately 20-30% of prisoners in these states are held in private facilities.
- Victoria: Maintains a hybrid model, with several major facilities (Ravenhall, Port Phillip) privately operated.
- WA: Re-nationalised some facilities recently but maintains a strong private presence in logistics and transport. [4]
Key Shifts in Prisoner Demographics
- Female Incarceration: The number of women in prison has grown by over 200% since 2000, significantly faster than the rate for men.
- Unsentenced (Remand) Population: In 1976, most people in prison were serving a sentence. In 2026, roughly 35-40% are “on remand” (waiting for a trial), a direct result of stricter bail laws.
- Indigenous Over-representation: This is the most persistent and worsening trend. Indigenous Australians make up ~3% of the population but 32% of the prison population in 2026.
Financial Outcome: The “Billion Dollar” Era
In 1976, corrections was a minor line item in state budgets. In 2026, it is a multibillion-dollar industry:
- National Spend: Exceeds $6.8 billion annually.
- The “Recidivism Trap”: Nationally, over 50% of people leaving prison in 2026 will return within two years, leading many economists to argue that the 50-year “expansion model” has failed to deliver long-term community safety.
[3] https://www.researchgate.net
[4] https://www.researchgate.net
[5] https://journals.sagepub.com
The historical tracking of recidivism in Australia is divided into two distinct eras: the Pre-1990s, where data was fragmented and inconsistent between states, and the Post-1990s, marked by the introduction of the national Report on Government Services (ROGS).
Despite a massive 400% increase in prison spending over the last 50 years, the national recidivism rate has remained stubbornly high, hovering between 40% and 55% for the last three decades.
Estimated Recidivism Rates (1976–2026)
Figures represent the percentage of released prisoners returning to prison with a new sentence within two years. [1]
| State | 1976 (Est.) | 1996 | 2016 | 2026 (Projected) |
|---|---|---|---|---|
| NSW | 38% | 42.1% | 48.2% | 51.5% |
| VIC | 32% | 34.5% | 44.1% | 43.8% |
| QLD | 35% | 39.0% | 45.4% | 47.2% |
| WA | 40% | 44.2% | 44.6% | 46.1% |
| SA | 34% | 35.8% | 46.2% | 45.9% |
| TAS | 30% | 38.4% | 45.1% | 51.3% |
| NT | 42% | 48.5% | 57.1% | 58.4% |
1. The “Revolving Door” Trend
In the 1970s, Australian prisons were smaller, and the population was dominated by “short-term” offenders. As mandatory sentencing and tougher bail laws were introduced in the 1990s and 2000s, the “revolving door” effect intensified.
- The NSW Surge: NSW has seen its recidivism rate climb past 50%. In 2026, more than half of those released will be back in a cell within 24 months.
- The NT Crisis: The Northern Territory has consistently held the highest rates in the country, driven by a lack of post-release support in remote communities and high rates of re-offending for mandatory-sentenced crimes. [2]
2. Victoria’s “Bail Reform” Impact
Victoria historically had the lowest recidivism rates in Australia. However, following the 2017-18 bail law reforms, the rate spiked from 35% to over 44%. [3]
- Why? Stricter bail laws meant more people were held on remand for minor offences. Once released, these individuals—often having lost housing or employment during their stay—were statistically more likely to re-offend.
- 2026 Pivot: Victoria is currently the only state showing a slight downward trend (dipping to 43.8%) due to a massive recent investment in “post-release housing” programs. [4]
3. The Impact of Privatisation (1990s–Present)
Since the mid-90s, the rise of private prisons (specifically in QLD, NSW, and VIC) has introduced “performance-linked” contracts.
- The Result: Data from 2026 indicates that private prisons do not necessarily have lower recidivism rates than public ones. In fact, some studies show higher re-offending rates for private prison leavers, often attributed to “leaner” staffing models that reduce the intensity of rehabilitation programs. [5]
4. Indigenous Recidivism Gap
This is the most critical failed metric of the last 50 years.
- National Average: ~45%.
- Indigenous Rate: ~65–70% in some jurisdictions.
- 2026 Outlook: Closing the Gap targets have struggled to move this number. In the NT and WA, the lack of culturally appropriate “through-care” (support from prison gate to home) remains the primary reason for these sustained high rates.
The Financial Failure of High Recidivism
In 2026, the “cost of failure” is a primary budget concern for State Treasurers:
- Cost per failure: Every time a prisoner returns in Victoria, it costs the taxpayer approximately $219,000 per year in direct prison costs, plus police and court time.
- The Investment Shift: States like SA and VIC are now shifting funds away from “new beds” and into “employment readiness” because the data proves that building more prisons does nothing to lower the recidivism rates shown above. [6]
[1] https://www.sentencingcouncil.vic.gov.au
[5] https://search.proquest.com
[6] https://digitalcommons.pace.edu
The socioeconomic profile of Australia’s prison population in 2025–26 continues to highlight a stark disconnect from the general public. Research from the Australian Institute of Health and Welfare (AIHW) and the Australian Bureau of Statistics (ABS) describes a population primarily drawn from the most disadvantaged areas of the country, characterized by low educational attainment, high unemployment, and housing instability. [1]
Socioeconomic Comparison: Prisoners vs. General Population (2025–26)
| Metric [2, 3, 4] | Prison Population (2025-26) | General Australian Population |
|---|---|---|
| Education (Year 12 Equiv.) | ~20% | ~64% |
| Education (Year 9 or below) | ~31% | ~5% |
| Unemployment (Pre-prison) | ~46% | ~4.0% (2026 Avg) |
| Homelessness (Post-release) | ~48% (Expected) | <1% |
| Median Age | 33.9 Years | 38.5 Years |
1. Educational Attainment
Education levels among prisoners are significantly lower than national averages, with the gap being most pronounced at the secondary and tertiary levels. [5]
- Secondary Schooling: Roughly 1 in 3 (31%) prison entrants have only completed schooling to Year 9 or below. Only 20% have completed Year 12 or its equivalent.
- Tertiary Education: Higher education is extremely rare; only 2.7% of entrants hold a bachelor’s degree and a mere 0.5% have a postgraduate qualification.
- Trade Skills: Vocational training is the most common non-school qualification, with 37% of entrants holding a trade certificate. [1, 5, 6]
2. Employment and Income
Employment status in the 30 days prior to incarceration is a primary indicator of socioeconomic vulnerability. [7]
- Pre-Prison Job Status: About 46% of entrants were unemployed before entering prison. Only 27% were employed full-time.
- Disability and Health: Approximately 13% of entrants reported being unable to work due to disability or long-term health conditions.
- Indigenous Disparity: Only 32% of First Nations entrants were employed before prison, compared to 49% of non-Indigenous entrants. [7]
3. Housing and Homelessness
Housing instability is both a driver of incarceration and a major barrier to successful reintegration. [8]
- Entrant Status: Roughly 1 in 3 people are homeless or in insecure housing immediately before entering prison.
- Exit Expectations: Nearly 1 in 2 (48%) of those being released in 2026 expect to be homeless upon discharge. This lack of stable housing is cited as the primary factor in high recidivism rates. [3, 8]
4. Demographic Over-representation
The socioeconomic burden of the justice system is not distributed evenly across the population. [9]
- First Nations People: While making up ~3.8% of the total population, Aboriginal and Torres Strait Islander people account for 37% of all prisoners as of June 2025.
- Geographic Concentration: Young people in the youth justice system are 6 times more likely to come from the lowest socioeconomic areas compared to those from the highest.
- Intergenerational Incarceration: Almost 1 in 5 (18%) prison entrants had at least one parent or carer who had been in prison during their childhood. [8, 10, 11]
[2] https://correctiveservices.dcj.nsw.gov.au
The last 50 years of rehabilitation policy in Australia have moved through three distinct phases: the Rehabilitative Ideal (1970s), the Managerialist/Punitive Turn (1990s), and the current Risk-Needs-Responsivity era (2020s). [1, 2]
Despite the evolution of theory, the practical application of rehabilitation has often been sidelined by overcrowding and “tough on crime” legislative agendas. [3]
1. 1976–1990: The “Welfare” Era
In the mid-1970s, prisons were still heavily influenced by a social welfare model.
- The Philosophy: Crime was seen as a product of social disadvantage. Rehabilitation focused on vocational training (printing, farming, laundry) and basic literacy.
- Key Policy: The Nagle Royal Commission (1978) in NSW was a turning point. it exposed the brutality of the “old system” and demanded a shift toward humane treatment and the “re-integration” of prisoners into society.
- The Outcome: This era saw the rise of “Work Release” programs where prisoners could leave during the day to hold jobs, though these were later scaled back as public sentiment shifted. [4, 5, 6, 7, 8]
2. 1990–2010: The Managerialist & Private Turn
The 90s saw a shift away from welfare and toward “Efficiency” and “Accountability.” [9]
- The Philosophy: The “Nothing Works” doctrine from overseas influenced Australian policy. Prisons shifted toward “warehousing”—keeping people secure and at a low cost.
- Privatisation: Starting with Borallon (QLD) in 1990, states began contracting out prisons. Rehabilitation became a “Key Performance Indicator” (KPI) in a contract.
- Mandatory Sentencing: The late 90s (particularly in WA and NT) saw mandatory sentencing laws. This filled prisons to capacity, meaning rehabilitation programs were often “waitlisted” so long that prisoners finished their sentences before starting them. [10, 11, 12, 13, 14]
3. 2010–2026: The “Evidence-Based” Era
Modern policy is dominated by the Risk-Needs-Responsivity (RNR) model. [15, 16]
- The Philosophy: We shouldn’t give everyone the same rehab. We must target high-risk offenders with intensive programs (Criminogenic needs) and leave low-risk offenders alone to avoid “contaminating” them.
- Through-care: In 2026, the buzzword is “Through-care”—the idea that rehabilitation must start in the cell and continue for 12 months after the gate opens.
- Justice Reinvestment: States (notably NSW and the ACT) are experimenting with “Justice Reinvestment,” where money is diverted from prisons into community-led programs in high-crime postcodes. [17, 18, 19, 20, 21]
Specific Program Shifts (1976 vs 2026)
| Program Type [22] | 1976 Approach | 2026 Approach |
|---|---|---|
| Education | Basic literacy / Hard-copy books. | Digital campuses / Laptop-in-cell (restricted). |
| Work | “Hard Labour” (Laundry, Woodwork). | High-tech certifications (Coding, Logistics). |
| Drug/Alcohol | Abstinence / Punishment for use. | Pharmacotherapy / Harm Minimisation. |
| Mental Health | Institutionalisation. | Cognitive Behavioural Therapy (CBT). |
The 2026 Reality: The “Waitlist” Barrier
While policy looks good on paper, the 2026 reality is a capacity crisis:
- Remand Interference: Because ~40% of prisoners are on remand (unsentenced), they are often ineligible for rehabilitation programs. By the time they are sentenced, their “time served” means they are released immediately without any transition support.
- Short Sentences: Prisoners serving under 6 months (common for driving or minor theft) are rarely given access to intensive rehab, despite being the group most likely to re-offend. [23, 24, 25, 26, 27]
[2] https://www.tandfonline.com
[6] https://corrections.qld.gov.au
[7] https://www.tandfonline.com
[10] https://journals.sagepub.com
[11] https://journals.sagepub.com
[13] https://www.austlii.edu.au
[14] https://www.austlii.edu.au
[15] https://www.tandfonline.com
[17] https://justice-trends.press
[19] https://www.tiraapendiwodli.org.au
[20] https://justicereinvestment.net.au
[21] https://www.justreinvest.org.au
[22] https://www.britannica.com
[24] https://www.theguardian.com
[26] https://www.justicereforminitiative.org.au
[27] https://www.researchgate.net
In 2026, the data across Australian states reveals a “U-shaped” crisis in recidivism. Prisoners serving very short sentences (under 6 months) and those serving very long sentences (over 5 years) show the highest rates of re-offending, but for completely different socioeconomic and policy reasons.
Recidivism Rates by Sentence Length (2025–26 Estimates)
Figures represent the percentage of prisoners returning to custody within two years of release.
| Sentence Length | Recidivism Rate | Primary Driver |
|---|---|---|
| < 6 Months | ~58% | “Churn”: Housing loss and lack of rehab eligibility. |
| 6–12 Months | ~42% | High enough for some rehab, but still high churn. |
| 1–2 Years | ~38% | The “Sweet Spot” for completed certificate programs. |
| 2–5 Years | ~41% | Disconnection from family/community networks. |
| 5+ Years | ~52% | Institutionalisation and lack of modern job skills. |
1. The Profile: The “Short-Sentence” Population
The group with the highest recidivism (under 6 months) is often referred to by planners as the “revolving door” cohort.
- The Profile: Often convicted of low-level property crime, drug possession, or repeated bail breaches. They have the highest rates of homelessness (~60%) and mental health issues.
- The Problem: Because their time is so short, they are legally or practically ineligible for intensive rehabilitation programs (which often take 6–9 months to complete).
- Outcome: They often spend their “time” in a high-security remand centre, lose their rental property or Centrelink payments, and are released with $40 and a bus ticket, leading almost immediately back to crime.
2. The Profile: The “Long-Term” Population
Those serving 5+ years face the “Institutionalisation” barrier.
- The Profile: Serious violent or drug-trafficking offences. They have often adapted entirely to prison culture and have “aged out” of their previous social circles.
- The Problem: Technology and the job market move faster than prison systems. A prisoner entering in 2016 and leaving in 2026 finds that basic tasks (using a digital MyGov ID or a smartphone) are alien to them.
- Outcome: Despite completing high-level rehab, the “culture shock” of the modern world leads to a failure in parole or a return to crime for social support.
3. Rehabilitation Strategies: What Works (2026 Data)
The 2026 strategy has shifted toward “targeted intervention” based on the specific sentence length:
For the “Short-Termers” (Post-Gate Focus)
- Rapid Rehousing: Victoria and NSW are trialling “Housing First” models where a prisoner is met at the gate with a 12-week head-lease on a flat. This has shown to reduce 6-month recidivism by ~20%.
- Through-Care Clinics: Managing drug withdrawals and mental health scripts before they leave the gate so there is no gap in medication.
For the “Mid-Termers” (Education Focus)
- Vocational Tiers: This group has the best outcomes. Strategies focus on Certificate II and III qualifications in high-demand industries (Warehousing, Civil Construction, Solar Installation).
- Employer Handshakes: Programs that guarantee a job interview with a partner employer (like the Big Build projects) upon release.
For the “Long-Termers” (De-institutionalisation Focus)
- Step-Down Facilities: Moving prisoners to low-security “cottages” for the final 6 months where they cook their own food, manage a budget, and use restricted internet to learn modern digital literacy.
- Day Release: Re-introducing day-work schemes in the final months to rebuild social “soft skills.”
The “Unsentenced” (Remand) Anomaly
In 2026, 38.4% of the national prison population is unsentenced (remand).
- The Policy Gap: Legally, people on remand are innocent and cannot be forced into rehabilitation.
- The Statistical Impact: Because they don’t engage in programs, they have the highest “first-time” recidivism rates once their case is eventually heard and they are released on “time served.”
Victoria’s prisoner profile has undergone a dramatic shift over the last decade, moving from a historically “low-incarceration” state to one defined by high remand rates and a massive surge in female and unsentenced prisoners.
Total Prisoner Population & Growth (2025–26)
Victoria currently detains approximately 7,000 to 7,500 people. While NSW has a larger total number (~12,500), Victoria’s growth rate in the 2010s was the fastest in the country following the 2013 and 2018 bail reforms.
| State | Total Prisoners (Est) | Incarceration Rate (per 100k) | % Unsentenced (Remand) |
|---|---|---|---|
| Victoria | ~7,200 | 135 | 44.2% |
| NSW | ~12,800 | 185 | 38.1% |
| Queensland | ~10,500 | 235 | 34.8% |
| NT | ~2,100 | 1,050+ | 32.0% |
The “Victorian Profile” vs. National Trends
1. The Remand Capital
Victoria has the highest proportion of unsentenced (remand) prisoners in the country. Nearly 45% of people in Victorian cells have not been convicted of the crime they are held for.
- The Impact: Because remand prisoners are in “legal limbo,” they are often ineligible for the robust rehabilitation programs Victoria is known for.
- Comparison: In Queensland and NSW, the remand rate is significantly lower (~35-38%), meaning a higher percentage of their population is actually engaged in long-term “Correctional” work.
2. Female Incarceration Surge
Victoria has seen a disproportionate rise in the imprisonment of women, particularly First Nations women.
- The Driver: Over 90% of women in Victorian prisons have a history of trauma, and the majority are held for low-level “crimes of poverty” or bail breaches.
- Policy Shift: In response, Victoria is currently pivoting toward gender-informed facilities and “bail support” programs to keep women out of the Dame Phyllis Frost Centre.
3. High Spend, High Infrastructure
Victoria spends significantly more per prisoner than most other states, focusing on “modern” infrastructure.
- The Cost: It costs roughly $599 per day to house a prisoner in Victoria (the highest in the country behind the ACT).
- The Infrastructure: Victoria recently completed the Western Plains “mega-prison,” which features advanced digital integration and better healthcare facilities than older “warehouse-style” prisons in Queensland.
Rehabilitation & Recidivism: The Victorian Difference
Victoria maintains a slightly better recidivism rate (~43.8%) compared to the national average (~45-50%), largely due to its “Through-care” model.
- Employment Focus: Victoria’s “Post-Release Support” programs are more heavily integrated with its “Big Build” infrastructure projects. There is a specific pipeline for former prisoners into civil construction roles that is less formalized in other states.
- The “Housing First” Trial: Victoria is leading a trial providing immediate, secure housing for 12 months post-release. Data suggests this reduces the “revolving door” effect for short-termers by nearly 20% compared to the NSW “transitional housing” model.
State-by-State “System” Comparison
- Queensland Model: Focuses on high-volume, low-cost “warehousing.” Highest rate of “doubling up” (two to a cell).
- NSW Model: Focuses on regionalization. Moving prisons to rural areas (like Clarence) to boost local economies while dealing with the largest total volume.
- Victoria Model: Focuses on “Program Intensity.” High daily cost, high staff-to-prisoner ratio, and a heavy focus on clinical mental health intervention within the prison walls.
The following comparison breaks down the 2025–26 financial commitments for corrective services across Australia. Figures are based on state budget papers and the 2026 Report on Government Services (RoGS).
Corrective Services Spending Breakdown (2025–26 Estimates)
Total corrections spend is split between the recurring cost to house a prisoner (OpEx) and the “Big Build” infrastructure projects (CapEx).
| State | Annual Operating (OpEx) | Annual Capital (CapEx) | Daily Cost per Prisoner |
|---|---|---|---|
| Victoria | $1.90 Billion | $90.7 Million | ~$599 (Highest) |
| NSW | $2.05 Billion | ~$200 Million (Est.) | ~$460 |
| QLD | $2.01 Billion | $580.0 Million (Avg.) | ~$369 (Lowest) |
| WA | $1.05 Billion | ~$110 Million (Est.) | ~$411 |
| SA | $0.54 Billion | ~$72.4 Million | ~$337 |
| NT | $0.49 Billion | ~$60 Million (Est.) | ~$330 |
1. Annual Operational Costs (OpEx)
Operational spending covers the day-to-day running of prisons, including wages, healthcare, and food.
- Victoria: Maintains the highest per-prisoner daily cost in the country. This is driven by high staff-to-prisoner ratios and a focus on clinical mental health services. For 2025–26, $1.76 billion is dedicated purely to frontline “prisoner supervision and support.”
- Queensland: Achieves the lowest daily cost through massive “high-capacity” facilities. While efficient on paper, this leads to the highest rates of “doubling up” (two prisoners per cell), which can increase safety risks for staff.
- Northern Territory: Despite the lowest daily cost, the NT has the highest total per-capita spend in the nation due to its massive incarceration rate (over 1,000 per 100k adults).
2. Annual Capital Expenditure (CapEx)
Capital spend is used for new prison wings, security technology, and replacing aging facilities.
- Queensland: Currently leads the nation in “Prison Big Builds,” with a multi-billion dollar program aimed at expanding capacity across Townsville and Brisbane to manage a 5.4% annual growth in prisoner numbers.
- Victoria: Following the completion of the “mega-prison” at Western Plains, Victoria’s 2025–26 CapEx has tapered to $90.7 million, focusing on minor expansions and system-wide security upgrades.
- South Australia: Spending $72.4 million over five years to add 116 beds and $6.8 million on high-tech “contraband detection” systems.
3. Central Government & Overhead Costs
This includes “hidden” costs like headquarters, parole boards, and legal oversight.
- Parole and Monitoring: A major central cost is the management of GPS electronic monitoring. The NT is spending an additional $6 million per year from 2025–26 to expand this capacity.
- Policy and Corporate: In Victoria, roughly $140 million of the total budget is estimated to sit in central headquarters for functions like prisoner healthcare contract management and digital records.
- Legal Aid and Ombudsman: These oversight bodies typically consume 3–5% of a state’s total justice budget but are essential for maintaining system integrity and meeting “duty of care” legal standards.
Efficiency vs. Outcomes
- The “Cost-Recovery” Myth: Prisons generate almost no revenue. While prison industries (laundry, woodwork) exist, they are designed for vocational training and recover less than 1% of a facility’s operating costs.
- Staffing Impact: Salaries account for roughly 70% of the daily cost. Victoria’s higher cost is almost entirely a result of higher staff numbers and more intensive “through-care” programs compared to the “warehousing” models seen in some other states.
To separate out Public Service direct costs, we must distinguish between the “coalface” operational spending (the money that actually enters the prison gate) and the “Bureaucratic/Departmental” overhead required to run the system from a central office.
In 2025–26, Victoria has the highest public service overhead in the country, largely due to the complexity of managing large-scale private prison contracts and integrated health services.
Direct Public Service Overheads (Estimated 2025–26)
These figures represent the “Central Command” costs: Policy, HR, Legal, Contract Management, and IT.
| State | Total Corrections Budget | Central Public Service Direct Cost | % Overhead |
|---|---|---|---|
| Victoria | $1.99 Billion | $159 Million | 8.0% |
| NSW | $2.25 Billion | $146 Million | 6.5% |
| Queensland | $2.59 Billion | $135 Million | 5.2% |
| WA | $1.16 Billion | $72 Million | 6.2% |
1. Victoria: The “Contract Management” Premium
Victoria’s public service costs are high because the state operates a “Hybrid” model.
- The Cost: Roughly $159 million is spent on central Department of Justice (DoJ) staff.
- The Reason: Because Victoria has several major private prisons (Port Phillip, Ravenhall), the public service must employ hundreds of “Contract Monitors” and “Compliance Officers” to ensure these private companies are meeting their 2026 performance targets.
- IT & Digital: A significant portion of this spend is the “Justice IT” stack—maintaining the prisoner records system and the new 2026 “Digital Prison” tablet rollout.
2. NSW: The “Regional HQ” Model
NSW has a slightly leaner central overhead percentage despite a larger budget.
- The Cost: $146 million on central Corrective Services NSW (CSNSW) administration.
- Efficiency: NSW has moved many “back-office” functions (like payroll and procurement) into a shared service model across all justice agencies (Police, Courts, Prisons), which has reduced the specific “corrections-only” overhead.
- Capital Planning: Much of the 2026 public service cost in NSW is dedicated to the massive long-term infrastructure planning team managing regional prison builds.
3. Queensland: The “High Growth” Lean Model
Queensland maintains the lowest administrative overhead per dollar spent.
- The Cost: $135 million on central overheads.
- The Reason: Queensland focuses its budget almost entirely on capacity. By running massive, standardized prisons, they require fewer central “bespoke” policy programs than Victoria.
- The Risk: Unions in 2026 have argued that QLD’s low administrative spend has led to a “policy vacuum” in prisoner safety and staff mental health support.
What is inside these “Direct Costs”?
When you see “Public Service Direct Costs” in a 2026 budget, you are paying for:
- The Parole Board: The staff and legal researchers who prepare thousands of case files for parole hearings.
- Health Contract Management: Governments don’t usually hire prison doctors directly; they hire public servants to manage contracts with private health providers (like Justice Health).
- Ombudsman & Oversight: The “Watchdogs” who investigate deaths in custody and prisoner complaints.
- Intelligence & Counter-Terrorism: Centralized teams that monitor phone calls and mail across the entire state-wide network to prevent organized crime from operating inside.
Outcome: The “Staff-to-Admin” Ratio
- Victoria: For every 10 prison officers on the ground, there is approximately 1 public servant in a central office.
- Queensland: For every 18 prison officers on the ground, there is 1 public servant in a central office.
The following comparison breaks down youth incarceration and recidivism data across Australian states for 2025–26, based on the latest Report on Government Services (RoGS) and the Australian Institute of Health and Welfare (AIHW).
Youth Incarceration Rates (2025–26 Estimates)
These figures represent the average nightly population of young people (aged 10–17) in detention and the rate per 10,000 of the youth population.
- Northern Territory (NT): 17.0 per 10,000
The NT maintains the highest per-capita rate in the country. On an average night, roughly 45–50 young people are in detention, reflecting the extreme geographic and social challenges in the region. - ACT: 5.4 per 10,000
Despite its small size, the ACT has a higher-than-average incarceration rate for its youth population, though its total nightly average is low (approx. 22). - Queensland (QLD): 5.1 per 10,000
Queensland holds the largest total number of children in detention (approx. 300 on any given night). This is driven by strict bail laws and high rates of repeat property crime. - New South Wales (NSW): 2.8 per 10,000
NSW has managed to keep its rate lower than QLD through intensive community-based diversion programs, with an average nightly population of 229. - Western Australia (WA): ~3.5 per 10,000
WA continues to face scrutiny over its youth detention facilities, with an average nightly population of approximately 90 young people. - Victoria (VIC): 1.4 per 10,000
Victoria has the lowest youth incarceration rate in Australia. This is largely attributed to its “dual track” system, which diverts many young offenders away from traditional adult-style prisons.
Youth Recidivism: Return to Supervision within 12 Months
Recidivism in youth justice is measured by the percentage of young people who return to sentenced supervision (either in detention or in the community) within one year of their previous sentence ending.
- Queensland: 71.5%
Queensland has the highest recidivism rate in the nation. More than 7 in 10 young people who leave the system return within 12 months. - Tasmania: 63.9%
Tasmania faces significant challenges with repeat offending, with rates well above the national average. - Victoria: 56.6%
While its incarceration rate is low, those who do enter the Victorian system have a roughly 57% chance of returning, highlighting the difficulty of rehabilitating the “high-risk” cohort. - South Australia: 42.7%
SA reports a lower-than-average return rate, which the state attributes to its integrated family-support models. - New South Wales: 39.9%
NSW currently reports the best outcomes for youth recidivism, largely due to “Youth Justice Conferencing” and high-intensity community monitoring.
Key Data Trends for 2026
The Remand Crisis
Nationally, 80% of young people in detention are unsentenced (on remand). They are waiting for their cases to be heard. Because they are not yet sentenced, they often cannot access the full suite of rehabilitation programs, which contributes to high re-offending rates when they are eventually released.
The “Million Dollar” Child
The cost of youth justice has reached extreme levels. Nationally, it now costs an average of $3,600 per day to keep a child in detention. In Victoria, the cost per child per year exceeds $2.6 million, reflecting a shift toward high-intensity staffing and smaller, more therapeutic facilities.
Indigenous Over-representation
Across Australia, Indigenous young people are roughly 28 times more likely to be in detention on an average night than non-Indigenous young people. In states like the NT and QLD, First Nations youth make up over 70% of the detention population.


Leave a Reply