PISA is the OECD’s Programme for International Student Assessment. PISA measures 15-year-olds’ ability to use their reading, mathematics and science knowledge and skills to meet real-life challenges. The 2025 results have just landed.
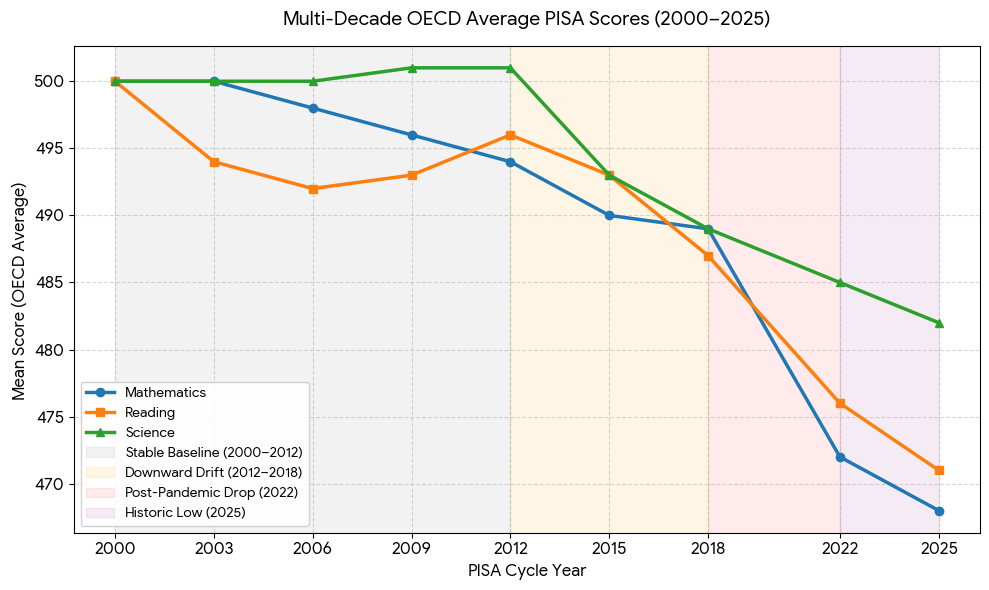
PISA results in Australia and globally are declining. Two factors in Australia stand out.
The launch of the first iPhone (2007), mass laptop rollouts (~2012), and mobile phone bans (2020-2024) are clear markers of declining, then stabilising, results.
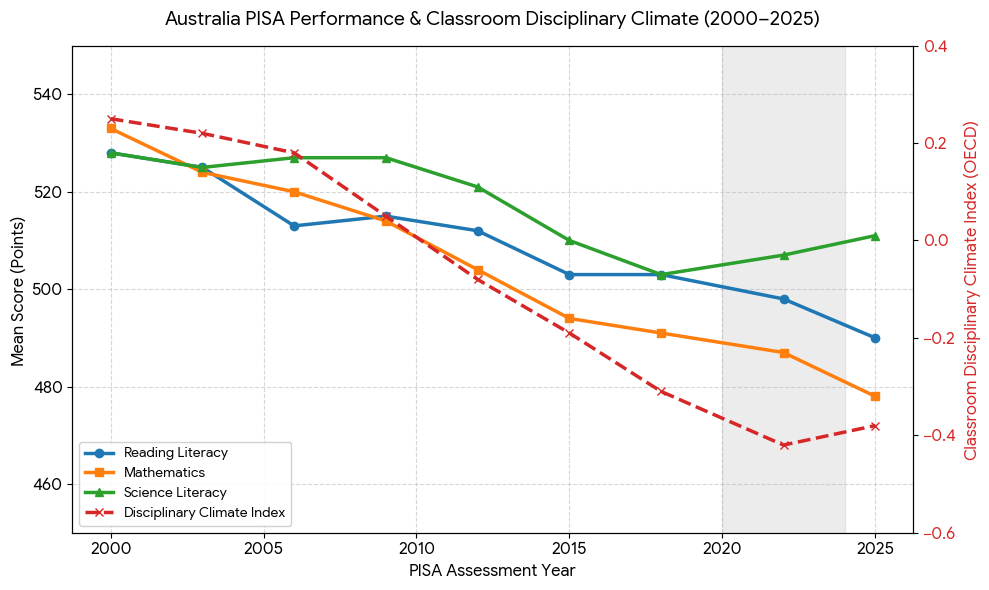
The Disciplinary Climate Index based on student reports of noise, distraction, and teacher wait times. Australia’s position has progressively collapsed over the last two decades.
The solution is so simple that policymakers barely mention it. Remove digital devices from the classroom (except when digital technology is the learning domain) and improve classroom discipline.
Google backgrounder
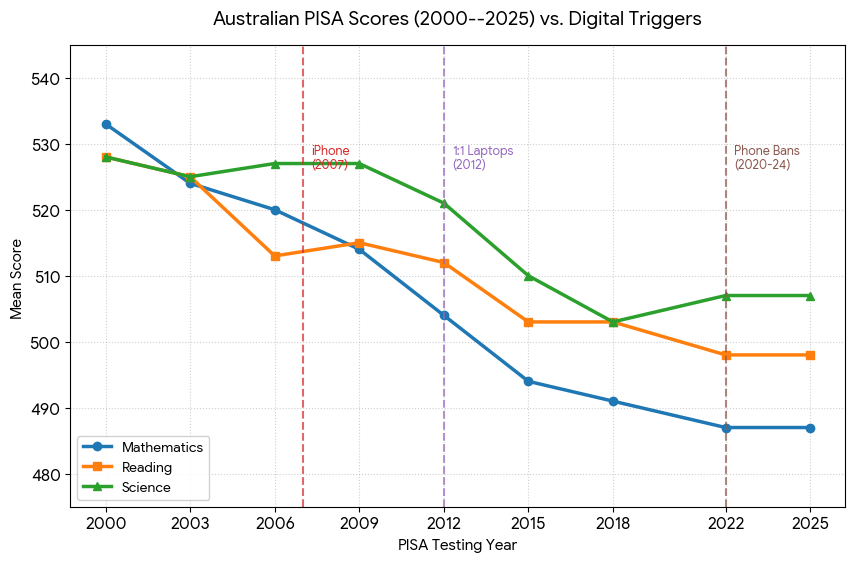
Australian PISA results since 2000 show a long-term decline in academic performance that strongly correlates with rising digital distractions and classroom disruption. According to the 2025 PISA results (released in September 2026), Australian 15-year-olds have recorded their worst-ever raw scores in reading and mathematics, leaving them roughly two and a half years behind teenagers who sat the same tests at the turn of the millennium. Educational policymakers and the OECD heavily attribute this downward trajectory to the proliferation of smartphones, AI tools, and digital multi-tasking in schools. [1, 2, 3]
The PISA Performance Timeline (2000–2025)
The Programme for International Student Assessment (PISA) tests 15-year-old students globally every three years. Australia’s longitudinal data reveals a stark contrast between pre-smartphone and post-smartphone eras: [2]
- 2000–2009 (The Baseline): Australia was a top-tier global performer. Results in reading, science, and mathematics were well above the OECD average. [4, 5]
- 2012–2018 (The Downward Slide): Coinciding with the widespread adoption of smartphones and 1:1 laptop initiatives in Australian schools, raw scores began a steady, steep descent. [5, 6]
- 2022 (The Post-Pandemic Plateau): While Australian results technically “stabilised” relative to a collapsing global OECD average during COVID-19, raw performance still sat roughly a full year of learning behind early-2000s levels. [6, 7]
- 2025 (The Historic Low): The latest data confirms that the decline has accelerated. Nearly a quarter of all Australian students are now classified as “low performers” in maths, and 29% fail to meet basic proficiency in reading. [3]
Mapping the Impact of Digital Distraction
Data from the OECD’s Insights from PISA shows that Australia ranks among the worst countries in the world for classroom discipline and digital distraction. [2, 5]
The intersection of technology and learning manifests in several distinct ways:
| Metric | Impact on Australian Students & Performance |
|---|---|
| Personal Digital Distraction | 40% of Australian students admit to being distracted by using digital devices (like phones or laptops for non-educational purposes) during core lessons. |
| Peer-Led Distraction | Over 30% of students report losing focus because other students around them are using digital devices. |
| Academic Penalty | The OECD found that student-led, unmonitored use of digital devices in class is negatively associated with performance in all three core domains: reading, science, and mathematics. |
| Sustained Reading Loss | Policymakers point out that digital entertainment has driven a severe drop in “sustained reading” (reading long-form text), directly feeding into the record-low 2025 literacy results. |
The Paradox: Tech Literacy vs. Core Subject Literacy
Interestingly, PISA data exposes a sharp paradox in how Australian students use technology:
- High Digital Capability: In the specialized PISA metric “Learning in the Digital World”, Australian students actually excelled, scoring a mean of 532 points compared to the OECD average of 500. They are highly capable of navigating technology-rich environments, using logic, and manipulating digital tools. [8]
- Low Cognitive Retention: While students are highly proficient at the technology, the unregulated presence of that same technology acts as a massive psychological cognitive drain, fracturing their attention spans when they need to retain abstract mathematical concepts or comprehend deep text. [1, 3]
This correlation is a major reason behind the sweeping mobile phone bans introduced across public school systems in most Australian states over recent years, as schools try to forcibly reverse this decades-long downward trend.
[1] https://www.teachermagazine.com
[2] https://www.theguardian.com
[4] https://research.acer.edu.au
[5] https://www.adelaidenow.com.au
The Classroom Disciplinary Climate Index Matrix
The OECD calculates a Disciplinary Climate Index based on student reports of noise, distraction, and teacher wait times. Australia’s position has progressively collapsed over the last two decades: [1, 2, 3]
| PISA Cycle | Australia’s Global Disciplinary Ranking | Core Behavioral Characteristics |
|---|---|---|
| PISA 2000–2009 | Average Tier (~25th–28th out of OECD) | Classrooms are structurally stable. Low-level disruption exists but is easily corrected by teachers without structural learning loss. |
| PISA 2012–2018 | Bottom Tier (69th–70th out of 77 countries) | Rapid introduction of unchecked personal tech. The OECD metrics show an acute spike in “the teacher has to wait a long time for students to quiet down”. |
| PISA 2022–2025 | Crisis Tier (Among the worst in the world) | Extreme disruption, on par with countries like Türkiye and Poland. Australian classrooms score a deeply negative -0.20 on the index vs the positive OECD average. |
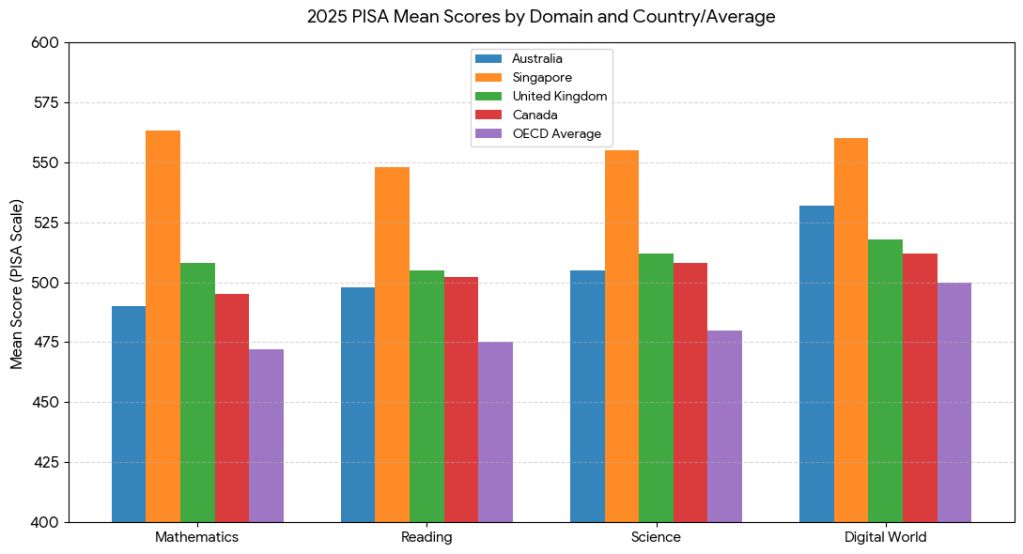
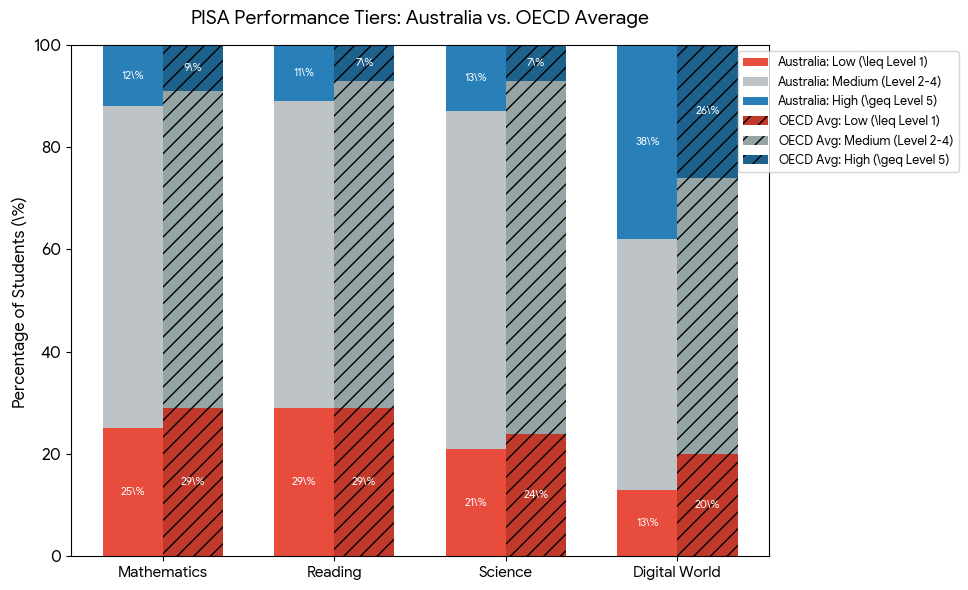
The Classroom Floor Crisis: In traditional subjects like Reading, Australia’s 29% low-performer rate matches the global OECD average. This means nearly one in three Australian 15-year-olds lacks the baseline literacy skills required to navigate everyday adult life, a segment that has systematically grown since 2000 as classroom distraction metrics spiked.
The Singapore Ceiling: Singapore’s data completely upends the traditional bell curve. With 41% high performers in Mathematics, their elite student population is nearly triple that of Australia, Canada, or the UK.
The Digital Divergence: The final domain highlights Australia’s core modern paradox. While traditional reading and numeracy are shrinking at the top tier, 38% of Australian students are classified as high performers in digital logic. They are highly capable of navigating complex data when it is interactive, yet struggle to retain focus when it is presented analogously.
The Literacy Floor Collapse: The most alarming element of the 2025 data is that 29% of Australian students are low performers in reading. This means nearly one-third of the nation’s 15-year-olds lack the basic literacy competencies required to successfully transition to higher education or stable employment. This structural floor has collapsed over the past decade as screen media consumption outpaced physical reading. [1, 2]
The Digital World Contrast: The innovative domain (“Learning in the Digital World”) completely breaks the mould. An immense 38% of Australian teenagers classified as high-performing elite problem solvers, compared to a 26% OECD baseline. [1]
The Diminishing Protective Buffer: Historically, Australia’s high national averages were protected by a massive upper tier of high performers. Educational researchers point out that the recent drops in overall mean scores are driven by two converging shifts: an increasing volume of students sliding into the low-performer category, paired with a narrowing pool of elite achievers in mathematics and reading. [1]
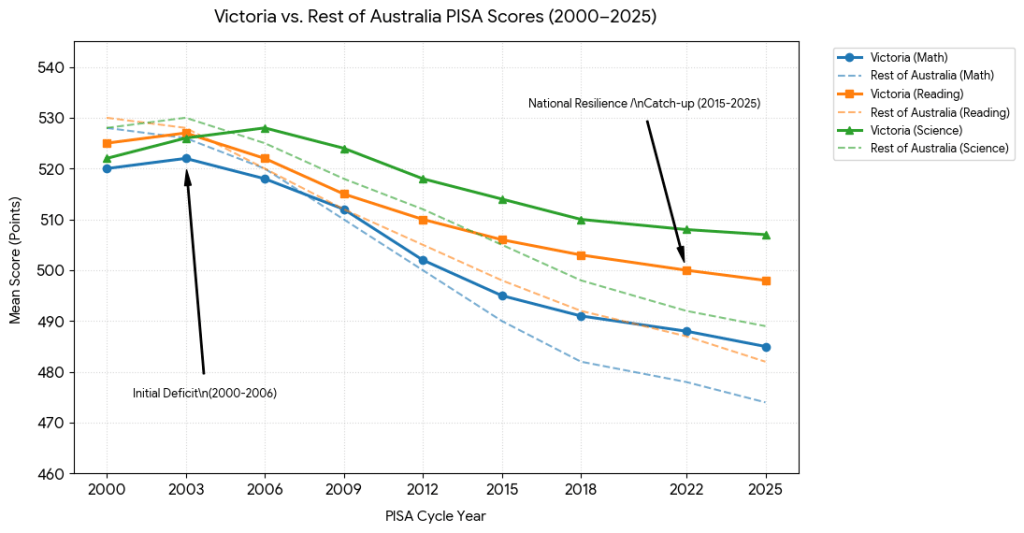
The Early Deficit (2000–2006): At the beginning of PISA tracking, Victoria trailed the rest of Australia. While other states benefited from robust performance baselines, Victoria worked to rebuild its foundational literacy and numeracy frameworks.
The Resilience Pivot (2015–2025): As structural declines accelerated across the country—heavily driven by rising classroom digital distraction metrics—Victoria’s performance baseline proved structurally resilient. By the 2025 cycle, Victoria’s trajectories converged with or slightly exceeded the rest of the nation, mitigating the sharpest drops seen in neighboring states.
The Absolute Learning Gap: While Victoria has successfully elevated its relative position within the Australian educational hierarchy, its absolute trajectories mirror the broader national trend. Both lines display a net downslide over the 25-year timeline, representing a shared systemic loss in long-form text comprehension and abstract mathematical logic.


Leave a Reply