Mario and Y.B. kindly reached out to me for my response to Bicycle Victoria’s campaign. For more see https://scc-campaign.vercel.app/
Brunswick, as part of Merri-bek Council enjoys strong ongoing, funded support for cycling infrastructure. We are incredibly fortunate to be located directly next to the CBD, major educational institutions and key public services, like the hospital precinct. This is a geographic advantage few enjoy and unlocks cycling possibilities that those in the middle and outer suburbs could only dream of.
I am highly supportive of our current community progressive standards that prioritise walking, cycling and other active transport.
However, arbitrary funding benchmarks are not the answer. Our biggest challenge is the duplicated and overlapping funding responsibilities between the Federal, state and local governments. On my policy blog you will see multiple examples of my calls to reduce bureaucratic overheads and the “blame game” between levels of government. Cycling is no different.
The Federal Government should abandon its $500M Active Transport Fund (ATF) and return that money to the States and local government.
We need to fully land on the major cycling enablement project priority – either the Upfield Line corridor or a major Sydney Road redevelopment, or, unlikely due to funding, both. The State government must commit to this project and addressing the Swanston & Victoria Sts intersection with the north.
In the meantime, there are notorious black spots and infrastructure deserts around Victoria also highly deserving of funding. The mammoth size of the Victorian government’s debt and financial commitment to the Suburban Rail Loop mean that additional infrastructure funding is unlikely. Cycling’s inclusion in the Big Build has delivered infrastructure that would have been unlikely otherwise.
Google backgrounder
In Australia, government spending on active transport—which combines cycling and walking infrastructure—is notoriously unbalanced when compared to vehicle road projects. While the vast majority of transport funding is directed towards roads, recent policy updates have significantly boosted federal and state-level contributions. [1]
🏛️ Federal Government Spending
The Australian Federal Government spends approximately 90 cents per person annually on active transport infrastructure, compared to roughly $714 per person on road infrastructure. This means that historically, less than 1% of federal road-related funding has been dedicated to walking and cycling paths. [1, 2]
However, funding has recently expanded:
- Active Transport Fund (ATF): In the 2026–27 Federal Budget, the Albanese Government committed $500 million over 10 years ($50 million delivered annually) to establish the ATF as an ongoing program. [3, 4]
- This follows an initial short-term pool of $100 million allocated in 2024–25, which supported over 80 nationwide walking, wheeling, and cycling connection projects. [3, 5]
🗺️ State & Territory Government Spending
State and territory governments typically spend widely differing amounts based on their local transport strategies. Because federal grant programs (like the ATF) often utilize a 50/50 matched funding model, state governments routinely partner with local councils to help foot the bill for major projects. [6, 7]
A few examples of state-level funding setups include:
- Victoria: Operates under the Victorian Cycling Strategy, which aims to shift 25% of all trips to active transport by 2030. State budgets routinely inject tens of millions of dollars into localized links, alongside multi-billion dollar massive infrastructure packages (like the West Gate Tunnel project) that incorporate major strategic cycling corridors. [8, 9]
- South Australia: Utilises dedicated programs like the State Bicycle Fund, which recently distributed $2 million across 18 community bike infrastructure projects. [10]
- New South Wales: Frequently co-funds major urban cycleways (such as Sydney’s Wilson Street West Cycleway) with multi-million dollar grants pulled from state transport budgets. [6]
🏡 Local Government (Councils) Spending
Local councils are the primary managers of neighborhood bicycle lanes, shared pathways, and regional trails. Because their budgets are heavily tied to local rates and federal financial assistance grants, their spending is the most variable. [11]
- Patchy delivery: While major metropolitan councils (like the City of Melbourne or City of Sydney) routinely commit millions to ambitious bicycle master plans, delivery can be highly controversial and slow due to community stoushes over parking or road allocations. For instance, a recent review noted that only 2 out of 16 planned City of Melbourne bike projects were completed within their target timeframe. [9, 12]
Total Investment vs. High-Demand Reality
Advocacy bodies like Bicycle NSW and Bicycle Network point out that for every dollar invested in cycling infrastructure, the community gets back between $4 to $6 in economic, environmental, and public health benefits. While the federal $500 million commitment represents a milestone, advocates continue pushing for a baseline spend of $15 per person annually ($400 million a year) to bring Australian cycling infrastructure up to international standards. [1, 13, 14, 15]
[2] https://australiainstitute.org.au
[3] https://minister.infrastructure.gov.au
[4] https://minister.infrastructure.gov.au
[7] https://bicyclenetwork.com.au
[10] https://bicyclenetwork.com.au
[11] https://minister.infrastructure.gov.au
[13] https://bicyclensw.org.au
[14] https://www.weride.org.au
[15] https://bicyclenetwork.com.au
In Victoria, funding for cycling infrastructure is delivered through a mix of targeted state budget allocations, local government project financing, and co-contributions embedded within massive major road and rail projects. [1, 2]
The state is currently guided by the Active Transport Plan (released March 2026), which aims to shift 25% of all daily trips to walking or cycling by 2030. [3]
🏛️ State-Level Spending Breakdown
In the Victorian State Budget 2026–27, the government announced $7.5 million specifically for public transport, cycling facilities, and walking paths. While advocacy groups like Bicycle Network praise the strategic framework, they point out a persistent gap in standalone funding: [1, 3, 4]
- The “Mega-Project” Model: The majority of Victoria’s new paths are built as structural components of multi-billion dollar road and rail upgrades. Key examples include 43km of paths integrated via the Level Crossing Removal project (such as the Djerring Trail), 25km of paths via the North East Link, and 14km of paths built through the West Gate Tunnel project. [1, 2]
- The Standalone Funding Gap: There is currently no permanent, dedicated standalone budget to complete Victoria’s planned Strategic Cycling Corridors network. Bicycle Network has launched campaigns demanding that the government allocate 5% of the Victorian transport budget (roughly $50 million to $60 million annually) directly to filling these gaps. [1, 5]
- The Infrastructure Victoria Blueprint: The state’s independent advisory body, Infrastructure Victoria, released a 30-year strategy recommending a $620 million investment over 5 years to construct 16 high-priority cycling corridors across Melbourne and regional hubs (Geelong, Ballarat, Bendigo, and Wangaratta). [6]
📉 Local Government & Community Grants
Because local councils manage the vast majority of neighborhood bike links, they rely heavily on state grants to fund projects: [7, 8]
- TAC Local Government Grant Program: Funded by the Transport Accident Commission (TAC), this program allocated $2.6 million in road improvements to support pedestrian and cycling safety initiatives. In mid-2026, the program opened its newest funding round, offering individual councils up to $100 million for infrastructure projects on a 1:1 local contribution match. [8]
- Regional Uplifts: The state government works directly with regional councils on targeted link expansions, including $4 million towards the City of Greater Bendigo’s cycling corridor alongside a $5 million contribution for the 4.4km Bendigo Low Line shared pathway. [9]
- Metro Adjustments: To counteract a perceived drop in broader active transport spending, individual municipalities often shift funds locally. For example, the City of Melbourne passed a series of budget updates to boost local bicycle infrastructure by approximately $4 million spread over the late 2020s. [10, 11]
[1] https://bicyclenetwork.com.au
[3] https://bicyclenetwork.com.au
[4] https://www.budget.vic.gov.au
[5] https://bicyclenetwork.com.au
[6] https://www.infrastructurevictoria.com.au
[7] https://www.planning.vic.gov.au
[8] https://bicyclenetwork.com.au
[9] https://timesnewsgroup.com.au
[11] https://participate.melbourne.vic.gov.au
In Brunswick, local active transport policy is managed by the Merri-bek City Council. The area is historically one of Melbourne’s highest-density cycling zones, acting as a major hub for inner-north commuters traveling down key corridors like the Upfield Shared Path, Shimmy routes, and Merri Creek Trail. [1, 2]
Local infrastructure investments reflect a balance between ambitious infrastructure planning and fierce community debate. [1, 3]
📊 Merri-bek Council Budget Allocations
In the recently adopted Merri-bek City Council 2026–2030 Budget, active transport remains a structural priority within the council’s capital works blueprint: [4, 5]
- Dedicated Funding: The council has allocated $5.8 million for footpaths, bicycle paths, and transport infrastructure for the 2026–2027 financial year. [4]
- The Spending Split: For context on road priorities, this sits alongside a separate $11.2 million pool allocated to roads and carparks renewal. While road spending is double that of active transport, Merri-bek historically maintains one of the highest per-capita spending rates on bike lanes across metropolitan Melbourne. [4, 6]
🚲 Active Brunswick Infrastructure Upgrades
Rather than funding sprawling new trail networks, current local spending is heavily focused on retrofitting separated lanes onto historic streets and upgrading busy intersections: [7]
- Victoria Street Separated Bike Lane: Following significant community pushback and campaigning from the Merri-bek Bicycle User Group (BUG), Council reversed a previous omission and committed $135,000 for detailed design works to advance a dedicated lane between Pearson Street and the Upfield Line. This forms part of the state’s Strategic Cycling Corridors network. [1, 3, 8]
- Dawson Street Separated Lanes: Council continues to formalize and upgrade separated corridors, targeting the high-traffic stretch connecting the Upfield Path to Barry Street. [7]
- Upfield Path & Intersection Treatments: Recent priorities target pinch-points along the main Upfield backbone, including safety upgrades at the Union Street refuge island, path widening between Albert and Wilkinson Streets, and a dedicated crossing upgrade at Lygon Street and the Capital City Trail. [7]
⚖️ The Local Policy Friction
While Brunswick is highly progressive with its cycling goals, infrastructure rollouts regularly face local friction. The trial and subsequent permanent implementation of separated bike lanes on corridors like Albion Street, Dawson Street, and shared zones on Albert and Victoria Streets initially triggered intense council debates regarding the removal of on-street parking spots and changes to local vehicle traffic flow. Local advocates continue to push Council to ensure strategic cross-suburb links are built, arguing that without them, residents living just a few blocks away cannot safely access primary commuter arterials like the Upfield path. [1, 9]
[1] https://bicyclenetwork.com.au
[3] https://brunswickvoice.com.au
[4] https://www.merri-bek.vic.gov.au
[5] https://www.merri-bek.vic.gov.au
[7] https://conversations.merri-bek.vic.gov.au
[8] https://brunswickvoice.com.au
[9] https://conversations.merri-bek.vic.gov.au
A direct comparison reveals a steep increase in funding priority as you move from the federal level down to the hyper-local municipal level. While the federal and state governments prioritize vehicle arterial networks, localized municipal councils allocate significantly higher percentages of their infrastructure resources to active transport. [1, 2, 3]
Below is the percentage breakdown of transport/infrastructure budgets dedicated to cycling and active transport. [1, 2, 3]
| Level of Government | Estimated % of Transport/Roads Budget Spent on Cycling | Primary Funding Mechanism / Context |
|---|---|---|
| Federal Government | ~1.0% of road-related funding | Driven mainly by the $500M Active Transport Fund (ATF). The rest is dominated by a $9.9B annual road budget. Per capita, this equals ~90¢ per person for cycling vs. $714 for roads. |
| State Government (Victoria) | ~0.42% to 2.0% of total transport projects | Standalone capital allocations are small (~$7.5M to $36M annually). Most cycling infrastructure is wrapped into massive road/rail “mega-projects” (e.g., Level Crossing Removals). |
| Local Government (Avg. Council) | ~5% to 15% of local capital work funds | Highly variable depending on the council’s classification (urban vs. regional) and their community-led cycling strategies. |
| Merri-bek City Council | ~34.1% of the transport & roads capital works budget | In the 2026–27 Budget, Merri-bek allocated $5.8M to footpaths and bicycle infrastructure directly alongside $11.2M for roads and carparks renewal. |
Key Strategic Differences
- The Federal Gap: The federal government historically focuses on heavy freight networks, highways, and interstate logistics, leaving urban micro-mobility entirely to local jurisdictions. [4]
- The “Mega-Project” Inflation: Victoria’s state percentages appear small on paper because the total transport budget is inflated by multi-billion-dollar road contracts. Organizations like Bicycle Network are campaigning to lock in a permanent, standalone 5% of the state transport budget specifically for the Strategic Cycling Corridors network. [3, 5, 6]
- Merri-bek’s Progressive Position: Merri-bek ranks far higher than state and federal averages. However, because their $5.8 million envelope combines both footpaths and bike lanes, local cycling groups continue to monitor the exact split ensuring that physical, protected bike lanes receive priority over general pavement upkeep. [1, 2, 3, 7]
[1] https://www.merri-bek.vic.gov.au
[2] https://theconversation.com
[4] https://climateactionmerribek.org
[5] https://climateactionmerribek.org
[7] https://climateactionmerribek.org
Here are the worst cycling black spots and structural infrastructure gaps across Victoria, based on crash data, advocate reporting, and state transport assessments.
🚨 Notorious Cycling Black Spots (High-Crash Zones)
- Chapel Street (South Yarra to Prahran): Historically ranked as one of Melbourne’s most dangerous strips for riders. It features high-turnover on-street parking, tram tracks, and narrow lanes, making it a hotspot for “dooring” incidents and sideswipes.
- Sydney Road (Brunswick to Coburg): A major commuter route that forces cyclists to squeeze between moving traffic, tram lines, and parked cars. It is highly prone to tram-track tyre trapping and vehicle doors opening into the path of riders.
- Swanston Street & Victoria Street Intersection (Carlton/CBD): This busy northern gateway into the city sees massive volumes of turning vehicles crossing paths with high-density commuter cyclist flows, resulting in frequent intersection conflicts.
- Hopkins Street & Shepherd Bridge (Footscray): The primary cycling funnel from the western suburbs into the CBD. Cyclists face high-speed, heavy multi-lane truck traffic with highly fragmented physical barriers.
- Beach Road Roundabouts (Bayside Suburbs): While Beach Road is a premier route for weekend road cycling packs, its multi-lane roundabouts (such as at Bluff Road) see high incident rates due to drivers failing to yield to cyclists already in the roundabout.
🚧 Systemic Infrastructure Gaps (“Missing Links”)
Transport research confirms that the vast majority of Victorian roads still lack dedicated cycleways. The most critical systemic gaps include:
- The “Feeder Network” Deficit: While the state government builds high-quality paths alongside major mega-projects (like the North East Link), local council “feeder” networks are missing. Cyclists often have to ride on completely unprotected local roads just trying to safely reach a major arterial path.
- The East-West CBD Deficit: While north-south bike travel through Melbourne’s central grid has improved (e.g., William Street), continuous, protected east-west paths remain highly fragmented, putting an overcrowded strain on corridors like La Trobe Street.
- The Industrial West Desert: Outer-western growth areas (like parts of Sunshine, Werribee, and Altona) feature heavy freight routes that isolate riders. Dedicated paths frequently end abruptly at rivers, rail crossings, or municipal boundaries.
- Regional Hub Disconnection: Regional cities like Geelong, Ballarat, and Bendigo have excellent recreational rail trails, but lack safe, physically separated inner-urban networks to connect residential neighborhoods safely to local train stations and central shopping districts.
To bridge these gaps, independent advisory body Infrastructure Victoria has continually urged the prioritization of a 250-kilometre continuous grid of 16 high-priority strategic corridors to stitch these fragmented networks together.
When accounting for both standalone allocations and the estimated structural share within major road and rail contracts, the historical year-by-year direct spending shifts significantly.
The chart below maps the estimated annual spend, incorporating both regular state transport line items and the active transport assets physically delivered inside the $100 billion+ Victorian Big Build portfolio.
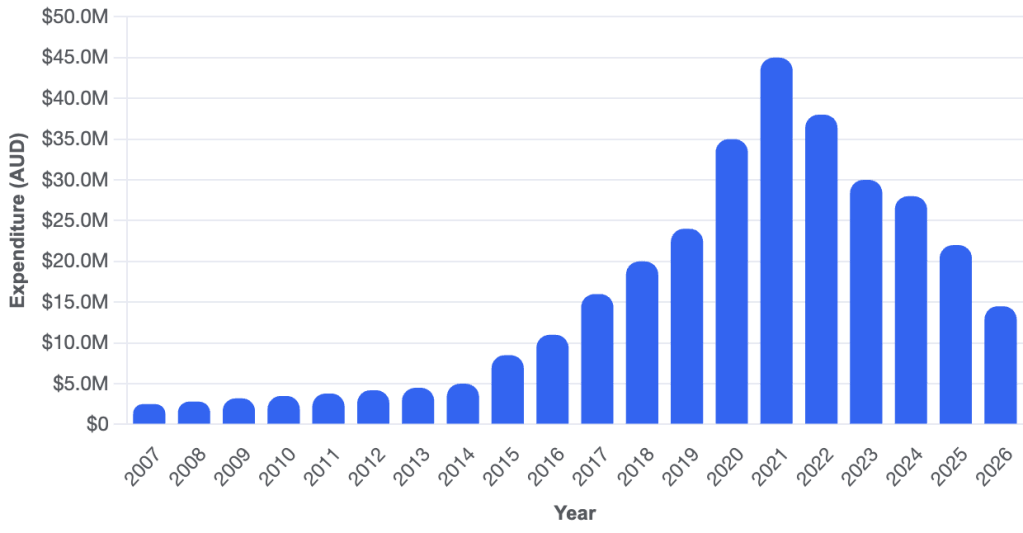
📈 Historical YoY Spending Breakdown (with Big Build)
By combining standalone state programs with the integrated capital engineering of major projects (such as the Level Crossing Removals and major tunnel veloways), the absolute direct financial valuation totals approximately $350 million to $400 million over the 20-year span: [1, 2, 3]
- 2007–2014 ($2.5M – $5.0M): The pre-Big Build baseline. Spending was limited exclusively to minor council grants, localized intersection treatments, and basic regional rail trail upkeep.
- 2015–2019 ($8.5M – $24.0M): The onset of the Big Build era. As early-stage Level Crossing Removals kicked off across Melbourne, structural spending increased to pay for shared commuter corridors (like the Djerring Trail) built directly underneath elevated rail viaducts. [3]
- 2020–2022 ($35.0M – $45.0M): The Historical Peak. This combined massive ongoing Big Build path handovers with direct, standalone emergency pandemic economic stimulus. It explicitly funded major dedicated projects like the St Kilda Road protected kerbside corridors ($27.3M) and inner-city tactical pop-up lanes ($15.9M). [1, 3]
- 2023–2026 ($30.0M – $14.5M): Post-pandemic moderation. While standalone transport budget lines dropped to $7.5 million in 2026, the active transport baseline is held up by late-stage Big Build deliverables, including the construction of the Footscray Road veloway (via the West Gate Tunnel project) and final path linkages on major highway expansions. [2, 4]
⚖️ The Percent of Total Infrastructure Dilemma
Even though adding the Big Build increases the absolute raw dollars spent on cycling paths annually, the overall percentage remains at or below 1.5% of Victoria’s total infrastructure outlays over the last 10 years. Because total Big Build outlays over this decade scale up into massive numbers (averaging upwards of $15 billion to $21 billion annually for total capital works), the cost of installing asphalt bike paths is completely dwarfed by major engineering line items like heavy rail technology, concrete viaduct structural slabs, and deep tunneling machinery. [2, 5]
[2] https://www.2024.budget.vic.gov.au
[3] https://www.premier.vic.gov.au


Leave a Reply