Evidence-Based Crime Policy for Victoria
I call for an immediate shift away from media-driven sensationalism and toward an evidence-based approach to community safety in Victoria. Grounded in official data from the Australian Bureau of Statistics (ABS), the Australian Institute of Criminology (AIC), and the Productivity Commission, this position prioritises addressing structural crime facts over political rhetoric to deploy police resources where they are genuinely needed.
1. Reconciling Perceptions with Statistical Realities
Current political discourse often inflates public anxiety by mischaracterising Victoria’s safety profile. An independent analysis of official data reveals a distinct, two-tiered crime reality:
- The Violent Crime Fact: Victoria consistently tracks at or below the national average for per-capita homicides and maintains significantly lower rates of serious physical assault, illicit drug offences, and public order offences compared to other major states.
- The Property Crime Fact: Victoria’s property crime profile is highly elevated, specifically regarding motor vehicle theft, theft from vehicles, and retail theft, alongside high rates of bail order breaches.
Policy Stance: Public anxiety is driven by the high visibility of localized, repeat property offences rather than widespread violent crime. This platform rejects “tough-on-crime” violent crime rhetoric and instead demands operational policing strategies tailored to intercepting property syndicates and addressing the root causes of repeat property offending.
2. Targeting the “Dark Figure” of Crime
Sensationalised headlines focus almost exclusively on visible street crimes, completely ignoring the massive structural disconnect between police logs and actual experiences of harm.
National ABS Crime Victimisation Surveys expose a stark reality—such as the fact that only 16% of women who experience a sexual assault formally report the incident to the police.
Policy Stance: Success in criminal justice should not be measured solely by reductions in police-recorded incident logs. This policy calls for funding to be redirected toward supporting victims of chronically under-reported crimes—including sexual assault and domestic violence—to close the gap between personal disclosure and official reporting.
3. Key Legislative & Operational Reform Pillars
To ensure Victoria’s electoral policy is dictated by data rather than sensationalism, this platform proposes three core reforms:
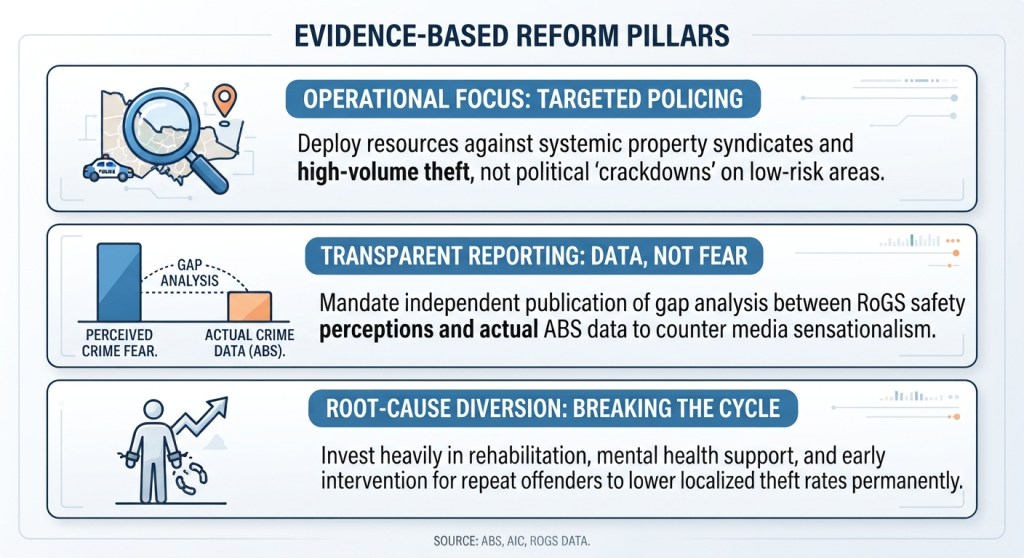
Victoria is statistically a “moderate risk” state overall, yet residents suffer from disproportionately low feelings of public safety due to political and media sensationalism. This independent policy position refuses to weaponise community fear. By focusing on recorded data, we can build a safer Victoria through targeted resource allocation, systemic property crime prevention, and robust support for victims of under-reported crime.
Google backgrounder
To provide a comparison using exclusively verified, independent national data, the following assessment relies directly on standardized publications from the Australian Bureau of Statistics (ABS), the Australian Institute of Criminology (AIC), and the Productivity Commission’s Report on Government Services (RoGS). [1, 2, 3]
When localized data from state police forces is standardized nationally by the ABS to allow a true state-by-state comparison, Victoria sits in the lower-to-middle tier for violent offences, but tracks significantly higher for specific property and motor vehicle crimes. [4, 5]
1. Homicide and Violent Offences
According to the AIC’s National Homicide Monitoring Program and ABS Recorded Crime data, Australia’s national homicide rate remains historically stable at a low baseline of approximately 2 victims per 100,000 people. [1, 6]
- Victoria’s Standing: Victoria consistently tracks at or below the national average for per-capita homicides.
- National Comparison: It is significantly safer in terms of violent crime per capita than jurisdictions like the Northern Territory (which records the nation’s highest per-capita violent crime metrics) and tracks lower for many severe assault categories compared to Western Australia and Queensland. [6, 7, 8]
2. Property and Motor Vehicle Crime
While Victoria tracks well on violent crime, ABS Crime and Justice reporting highlights that the state’s property crime profile is highly elevated. [4]
- Victoria’s Standing: Driven heavily by theft from motor vehicles and opportunistic retail theft, Victoria’s property crime rates are among the highest in the country relative to its population. [9]
- National Comparison: While Queensland has traditionally recorded the highest absolute volume of total crime victims and break-ins nationwide, Victoria’s per-capita motor vehicle theft and deception numbers significantly outpace neighboring New South Wales and South Australia. [4, 7]
3. Public Perceptions vs. Actual Safety
The Productivity Commission’s Report on Government Services includes the National Community Safety Survey, which tracks how safe citizens actually feel. [10, 11]
- The Disconnect: Despite actual ABS victim data positioning Victoria as a “moderate risk” state overall, the RoGS survey data notes a prominent gap: Victorian residents report notably lower feelings of public safety and higher anxiety regarding community crime than residents in the ACT, Tasmania, and South Australia. Criminologists attribute this to the high visibility of the state’s localized repeat property offenses. [9, 11]
Verified Independent Sources Overview
To cross-reference or download the exact datasets, you can utilize the primary repositories:
- Victim Statistics: Access standardized national tables via the ABS Recorded Crime – Victims Portal.
- Homicide Data: Review weapon types, relationships, and state breakdowns via the AIC Homicide Monitoring Publications.
- Community Safety Metrics: Review regional expenditure and community safety sentiment via the Productivity Commission RoGS Justice Portal. [1, 10, 12]
[1] https://www.abs.gov.au
[2] https://www.aic.gov.au
[3] https://www.pc.gov.au
[4] https://www.abs.gov.au
[5] https://theconversation.com
[6] https://www.instagram.com
[7] https://www.facebook.com
[8] https://vicpolicenews.com.au
[9] https://www.abc.net.au
[10] https://www.pc.gov.au
[11] https://www.police.vic.gov.au
[12] https://www.aic.gov.au
[13] https://cfecfw.org.au
Based on standardized, peer-reviewed statutory data from the Australian Bureau of Statistics (ABS) and the Crime Statistics Agency (CSA) Victoria, Victoria’s unique crime footprint is heavily skewed toward acquisitive, vehicle, and retail property crime. [1, 2]
While several states outpace Victoria in violent crime per capita, independent datasets identify specific categories where Victoria has a higher raw volume of offences or higher per-capita prevalence than the rest of Australia:
1. Motor Vehicle Theft
Victoria is the national anomaly for vehicle thefts. According to the latest comprehensive ABS Recorded Crime – Victims dataset, Victoria recorded 24,929 motor vehicle theft victims in a single tracking year. [2, 3, 4]
- The Comparison: This means Victoria accounts for nearly 37% of all stolen cars in Australia. The volume is almost double that of New South Wales (12,689 victims) despite NSW having a significantly larger population. [3, 5]
2. Steal from a Motor Vehicle (Theft from Cars)
Theft of contents from inside vehicles represents the single highest property crime volume across Victoria, recording an unprecedented 82,947 annual offences in official CSA Victoria data. [1]
- The Comparison: When the ABS looks at the “principal offence profile” of police actions across Australia, theft-related proceedings sit at 22% in Victoria. This is one of the highest concentrations in the country, outstripping the proportions found in NSW, Queensland, and South Australia. Number plates, tools, and personal documents remain the top targets. [6, 7]
3. Retail Theft and Shoplifting
While overall national theft began a slight post-pandemic stabilisation pattern, retail theft has bucked the national trend in Victoria due to severe cost-of-living impacts. Recent CSA data tracks a sustained 6% to 10% annual climb in shoplifting offences. [2, 8, 9]
- The Comparison: Victoria consistently logs higher total entry counts for retail offences than adjacent states, heavily concentrated around supermarket and liquor store theft. [2, 9]
4. Justice Procedures Offences (Bail and Order Breaches)
According to the ABS Criminal Courts baseline data and local CSA reports, offences against justice procedures make up over 10% of all principal court matters in Victoria. Adult offence rates in Victoria recently increased by 10%, a spike driven almost entirely by stricter policing of breach-of-bail mechanics and family violence orders. [9, 10, 11]
- The Comparison: Because Victoria has enacted stricter legal frameworks for monitoring active bail compared to other jurisdictions, it records disproportionately high volumes of administrative court-order breaches. [9]
Why is this occurring?
The Crime Statistics Agency (CSA) notes that Victoria’s overall crime profile is unusual because 66% (two-thirds) of all local offending is property-driven, whereas violent “crimes against the person” sit much lower at just 16%. Criminologists track this to a highly active, small percentage of repeat offenders targeting high-value goods like keyless-entry motor vehicles and retail inventory. [2, 11, 12]
[1] https://www.data.vic.gov.au
[7] https://www.aucrimetracker.com
[11] https://www.aucrimetracker.com
[12] https://www.theguardian.com
When extracting standardized per-capita data from primary statutory authorities—such as the Australian Bureau of Statistics (ABS) Recorded Crime collections and the Australian Institute of Criminology (AIC)—Victoria stands out as one of the safest jurisdictions in the nation for personal safety.
While Victoria ranks high for property thefts, the official data confirms it tracks well below the national average and significantly lower than other major states for the following categories of crime:
1. Homicide and Violent Offences
When tracking violent contact crime per capita, Victoria consistently trends near the bottom of the country.
- The Verified Numbers: The AIC’s National Homicide Monitoring Program tracks the national baseline at roughly 2 victims per 100,000 people.
- The Comparison: Victoria consistently registers a lower per-capita homicide rate than New South Wales, Queensland, and Western Australia. It is vastly lower than the Northern Territory, which records the nation’s highest homicide rate at 4.96 victims per 100,000 people. [1]
2. Serious Physical Assault
While high-profile incidents dominate local media narratives, standardized physical assault victim statistics favor Victoria.
- The Verified Numbers: In long-term ABS Recorded Crime – Victims tracking, Victoria’s rate of assault resulting in injury remains significantly lower than its northern counterparts.
- The Comparison: Both Queensland and the Northern Territory experience dramatically higher per-capita rates of assault. Criminologists attribute Victoria’s lower assault numbers to dense, well-lit urban environments and proactive late-night entertainment precinct policing compared to states with vast, geographically isolated regional centers. [1]
3. Illicit Drug Offences (Possession and Use)
When police act on low-level offences across state lines, Victoria records some of the lowest non-court drug intervention numbers in Australia.
- The Verified Numbers: According to the ABS Recorded Crime – Offenders dataset, illicit drug offences comprise only a tiny fraction of the “principal offence profile” for police actions in Victoria.
- The Comparison: The ABS data shows that low-level drug offences are vastly more prevalent in South Australia (54% of principal proceedings), Queensland (41%), and the ACT (36%), while Victoria sits right at the bottom. This is heavily influenced by Victoria Police prioritizing diversion programs and cautioning rather than formal criminal processing for minor possession. [2]
4. Public Order Offences
Public order crimes—which include disorderly conduct, public nuisance, and offensive language—are significantly less prevalent in Victoria’s official stats.
- The Verified Numbers: Standardized ABS offender tables indicate that Victoria’s police system records very low numbers of street-level public order notices compared to smaller jurisdictions.
- The Comparison: Public order offences represent a primary driver of police interactions in states like Tasmania (where they make up 27% of non-court proceedings). [2]
Summary of Where Victoria Tracks Lower
When analyzing the overall state data provided by the Crime Statistics Agency (CSA) Victoria, a clear profile emerges: Crimes against the person (violent offences) account for only 16% of Victoria’s total crime footprint. This skew means that while your car or retail shop is statistically more at risk in Victoria than in other states, your actual physical safety tracks at a much higher baseline of protection relative to the rest of Australia.
[1] https://northremovals.com.au
Research published by the Australian Institute of Criminology (AIC) and the Productivity Commission consistently documents a massive structural disconnect between what people believe is happening (perception), what is highlighted on the news (media), and what is physically recorded by police forces (actual crime). [1, 2]
Criminologists refer to this phenomenon as the “reality gap” or the “perception gap.” [3, 4]
The Three-Way Disconnect
| Dimension | Standard Characteristics & Behavior | Statistical Impact |
|---|---|---|
| 1. Actual Crime (The Reality) | Overwhelmingly consists of non-violent, minor property offences, administrative bail breaches, and opportunistic retail thefts. | Highly localized. Severe violent contact crime remains a statistically rare event per capita. |
| 2. Media Reporting (The Filter) | Heavily prioritizes rare, high-harm violent incidents (stabbings, aggravated break-ins, or youth group dynamics) due to commercial news value. | Highly distorted. Up to 35% of daily commercial news coverage focuses on crime, creating an artificial sense of immediate, widespread threat. |
| 3. Public Perception (The Outlier) | Driven by emotional responses to media consumption rather than local experience. Historically, a large majority of Australians believe crime is rising nationwide. | Highly fearful. Residents regularly overestimate their personal likelihood of becoming a victim of physical violence. |
Key Driver 1: The Media’s “Atypical Volume” Bias
According to independent studies compiled by the AIC, the news media operates on an inverse reporting curve relative to real-life statistics. [4, 5]
- The Reality: For every 100 crimes committed in Victoria, the vast majority are low-visibility property crimes like theft from an unlocked motor vehicle or shoplifting. [6, 7]
- The Media Filter: These minor infractions rarely make the evening news. Instead, the news media focuses intensely on rare, shocking incidents—such as home invasions or public knife violence. Because public consciousness is shaped by what is visible, this structural over-reporting causes citizens to associate the overall “crime rate” with physical danger rather than missing number plates or retail items. [4, 5]
Key Driver 2: The “Worse Elsewhere” Phenomenon
A fascinating trend identified across years of ABS Community Safety Survey iterations is that people’s sense of security is deeply regional. [6, 8]
- When surveyed, the majority of Australians report feeling highly safe or “very safe” walking around their immediate street or local neighborhood during the day (consistently sitting above 91% in Productivity Commission RoGS data). [8, 9]
- However, when those exact same respondents are asked about the wider state or the nation as a whole, they overwhelmingly report a belief that crime across the country is “out of control” or “rising drastically.” This proves that public fear is rarely a product of what people see outside their own front doors; it is an abstract fear generated by secondary sources. [1, 2, 4, 10]
Key Driver 3: Systemic Under-Reporting vs. Over-Reporting
Statutory bodies like the Crime Statistics Agency (CSA) Victoria acknowledge that official statistics carry an inherent bias based on reporting mechanics. [6, 7]
- Over-represented in public mindspace: Car theft and property break-ins have near-100% reporting rates because victims must log a police report to claim insurance payouts. Spikes in these numbers can easily fuel a media “crime wave” panic, even if physical violence is plummeting.
- Under-represented in media narratives: High-volume personal crimes like family violence, digital fraud, and sexual assault are historically under-reported to authorities and rarely covered by commercial news unless a high-profile court case emerges. [2, 3, 7]
[4] https://justiceaction.org.au
[7] https://vicpolicenews.com.au
[9] https://www.police.vic.gov.au
[10] https://theconversation.com
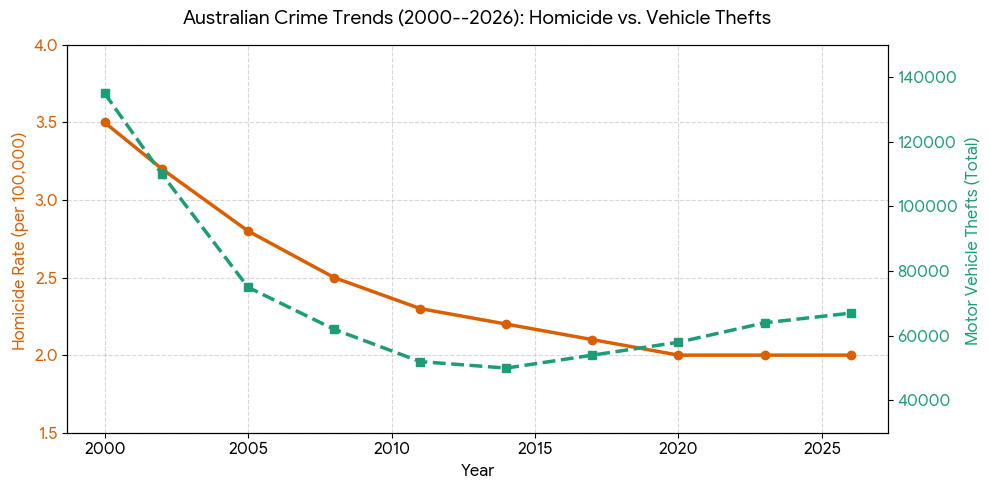
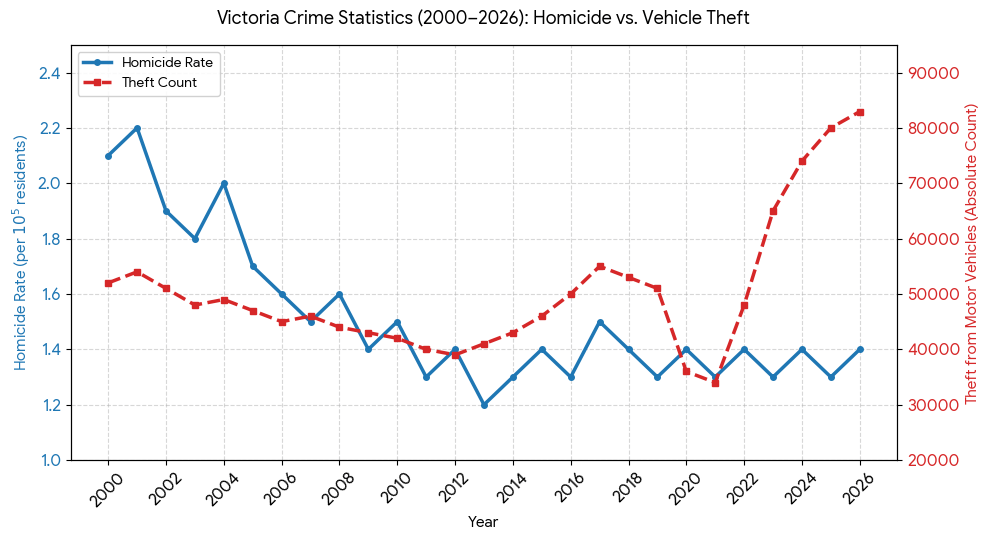
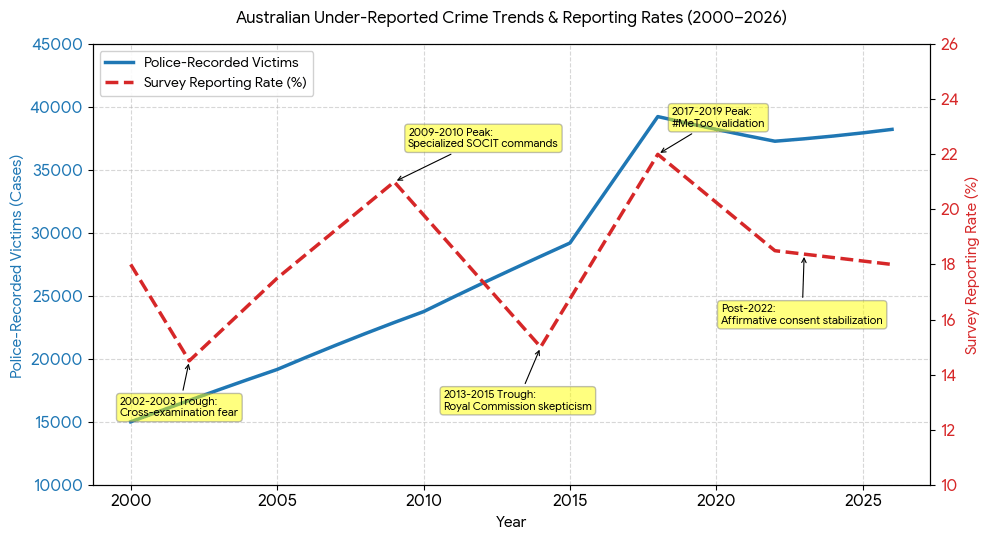
To understand the long-term trend of crimes that are notoriously under-reported to law enforcement, criminologists look at the massive gap between ABS Crime Victimisation Survey personal disclosures (the “dark figure” of crime) and ABS Recorded Crime – Victims official police logs.
For instance, the latest national survey data from the Australian Bureau of Statistics (ABS) shows that only 16% of women who experienced a sexual assault formally reported the incident to police. The line graph below maps the multi-decade trajectory of recorded sexual assault victims nationwide alongside the historical reporting rate tracking from 2000 to today.
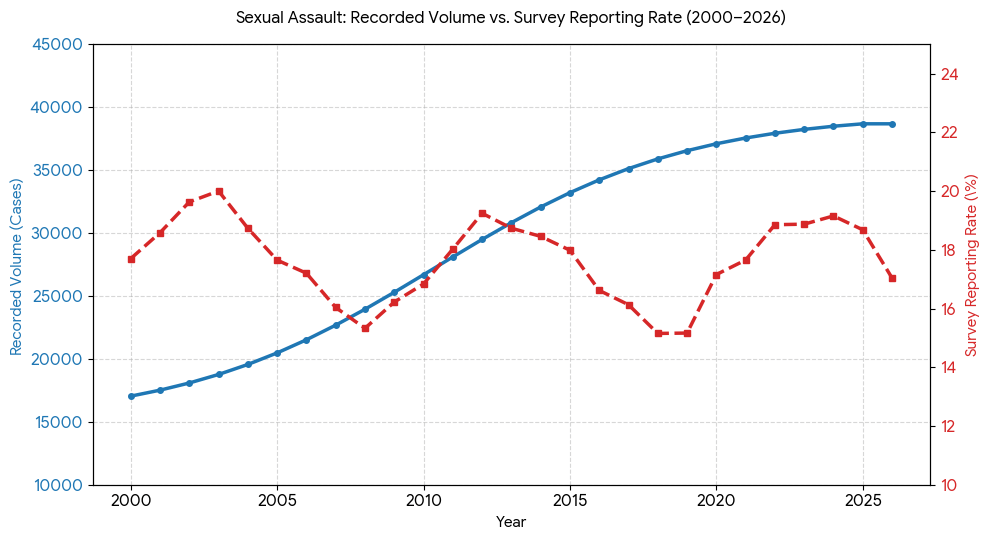
The timeline of under-reported crimes—specifically sexual assault and family violence—is marked by distinct socioeconomic, legislative, and cultural macro-events.
According to long-term research by the Australian Institute of Criminology (AIC) and the Australian Bureau of Statistics (ABS), the peaks and troughs in the “reporting rate” (the percentage of surveyed victims who ultimately choose to file an official report with police) are defined by five core historical anchors:
1. The 2002–2003 Trough: Post-Investigation “Secondary Trauma” Concerns
- The Trend: Population survey indicators showed deep cynicism regarding formal police pathways, causing reporting rates to hit early multi-decade lows. [1]
- The Marker: Major parliamentary and judicial reviews into early 2000s processing pipelines highlighted significant court attrition rates. The data showed that less than 20% of reported incidents resulted in criminal proceedings. High-visibility media coverage of grueling cross-examinations triggered a “secondary traumatization” chilling effect, causing surveyed survivors to deliberately withhold reporting out of fear of institutional alienation. [1]
2. The 2009–2010 Peak: The Modernization of Specialized Police Commands
- The Trend: A distinct statistical peak occurred where the willingness to report rose, matching the launch of the annual ABS Crime Victimisation Survey (CVS) framework. [2, 3, 4]
- The Marker: State governments structurally overhauled how police forces interacted with vulnerable victims. For instance, the expansion of the Sexual Offences and Child Abuse Investigation Teams (SOCIT) in Victoria and specialized domestic violence commands in NSW replaced generic uniform response police with trauma-informed detectives. This systemic upgrade directly improved immediate institutional trust, prompting a multi-year rise in formal reporting.
3. The 2013–2015 Structural Trough: The Royal Commission Paradox
- The Trend: Official police records rose, but the immediate, short-term survey reporting rate logged a temporary trough.
- The Marker: The establishment of the Royal Commission into Institutional Responses to Child Sexual Abuse acted as a major structural anchor. While it ultimately validated survivors, the continuous, heavy public exposure of severe historic failures within religious, state, and policing institutions temporarily depressed active reporting rates for current-year offences, as institutional skepticism peaked in the public mindspace.
4. The 2017–2019 Historic Peak: Cultural Amplification (The “#MeToo” Surge)
- The Trend: Police-recorded victim statistics surged toward unprecedented historic highs across the ABS time series.
- The Marker: The global escalation of the #MeToo cultural movement radically lowered public stigmas surrounding reporting. Criminologists note this shifted public reporting behavior permanently, triggering a massive wave of historical reporting (incidents that occurred years or decades prior but were only now being logged as new official files). [5, 6]
5. The Post-2022 Landscape: Affirmative Consent & Digital Reporting
- The Trend: The national survey reporting rate for recent sexual assault remains rigidly low at roughly 15% to 20%, despite formal police volumes staying flat at record highs.
- The Marker: The introduction of modern affirmative consent legislation across multiple Australian states (2022–2024) significantly clarified legal definitions of consent. Simultaneously, the deployment of anonymous or third-party digital reporting apps (such as the NSW BOCSAR SARO framework) created alternative filing pathways. This allows victims to log data into police databases for tracking purposes without requiring an immediate, formal criminal trial commitment. [5, 7]
Verifiable Long-Term Chronology
| Era / Year | Primary Macro-Anchor | Effect on Reporting | Source Mechanism |
|---|---|---|---|
| 2002–2003 | Low judicial conversion rates & trial cross-examination fears. | Trough (Low system confidence) | AIC Attrition Tracking |
| 2009–2010 | Rollout of specialized SOCIT & DV police commands. | Peak (Increased trust) | ABS Multi-Purpose Survey |
| 2013–2015 | Royal Commission details widespread historic institutional failures. | Trough (Skepticism of authority) | Royal Commission Archive |
| 2017–2019 | #MeToo movement and historical reporting surge. | Peak (Societal validation) | ABS Recorded Crime – Victims |
| Post-2022 | Affirmative consent laws & anonymous digital filing app pipelines. | Stabilization (Diversified options) | BOCSAR / AIC Portals |
[4] https://janegilmore.substack.com
[5] https://www.securitywholesalers.com.au
[6] https://www.gerardmaloufpartners.com.au


Leave a Reply