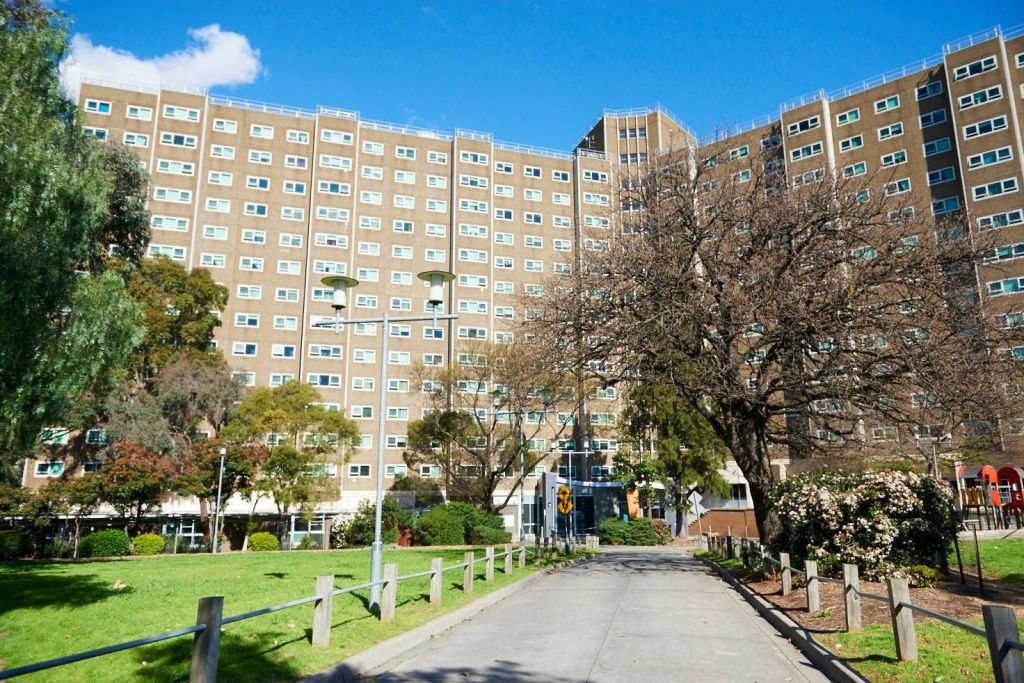
Not community housing, not cooperative housing, but public housing. Invest in public housing, run by the public, for the benefit of all. Innovations in alternative housing schemes are welcome, but there remain many risks with investing public money or bestowing public gifts on housing solutions that don’t target those most in need.
If you’ve been following the news, you’ll see there remain daily reminders of poor policy, poor administration and poor outcomes.
Public-Private Partnerships (PPPs) to deliver public housing are a direct transfer from the public to private developers and individuals. The Victorian government has effectively sold off public housing to afford needed upgrades. There is a shocking lack of transparency over PPPs and the resultant housing outcomes.
“Social housing” is another way the government seeks to rid itself of direct responsibility and control over housing. Providers are then left to navigate the myriad overlapping funding arrangements from different levels of government to fund ongoing operations. This reduces direct scrutiny of policy outcomes, results in cost-shifting and cross-subsidisation within organisations, and creates expensive public overhead in designing and administering the scheme, not in delivering the services. Failures in these systems then lead to even more bureaucracy and regulation.
There are as many people on public housing waiting lists as there are in total public housing. There are 64,000–65,000 public housing dwellings (Housing Victoria). 65,000 people are on the Victorian social housing waitlist, with 37,000 classified as priority applications.
The State government alone cannot be expected to deliver double its public housing capacity overnight, but taxpayers are entitled to know whether their direct spending on housing is actually providing affordable housing to those who need it.
State (and Federal) governments sell-off of public land for private housing, instead of directly developing public housing, is a wasted opportunity.
https://architectureau.com/articles/nightingale/
https://paulvanherk.substack.com/p/assemble-housing-are-cheating-the
Victoria has the lowest proportion of social and public housing stock in Australia relative to its overall housing market. Despite the state’s multi-billion dollar Big Housing Build initiative, decades of systemic under-investment have left Victoria languishing behind the national average and all other states and territories. [1, 2, 3]
State-by-State Breakdown
Data compiled by the Community Housing Industry Association (CHIA) Victoria outlines the disparity in social housing footprints across jurisdictions as of mid-2025: [4]
| State / Territory [5, 6, 7, 8] | Total Social Homes (June 2025) | Share of Total State Housing Market (%) | Projected Market Share (2030) |
|---|---|---|---|
| Northern Territory (NT) | 11,041 | 13.07% | 15.16% |
| Australian Capital Territory (ACT) | 11,873 | 6.42% | 6.56% |
| South Australia (SA) | 46,686 | 6.01% | 5.84% |
| Tasmania (TAS) | 13,646 | 5.59% | 7.41% |
| New South Wales (NSW) | 156,735 | 4.74% | 4.85% |
| Western Australia (WA) | 44,234 | 3.94% | 4.08% |
| Queensland (QLD) | 76,426 | 3.51% | 4.00% |
| Victoria (VIC) | 87,356 | 3.21% | 3.23% |
Key Vulnerabilities in Victoria’s System
- The Bottom of the Ladder: Victoria’s social housing footprint sits at roughly 3.2%, which is significantly lower than the national average of approximately 4.1% to 4.5%.
- Stagnating Projections: While states like Queensland and New South Wales have committed to pipeline developments that will scale their market percentages by 2030, Victoria’s share is projected to flatline—growing by a minor 0.02 percentage points over the next four years.
- Outsized Housing Stress: According to the Council to Homeless Persons, Victoria registers the worst levels of housing stress nationwide. The state accounts for roughly 36% of all Australians seeking specialist homelessness support, yet its safety net remains the smallest by volume percentage.
- Growing Waitlists: With over 56,000 families on the Victorian social housing registry, peak bodies estimate the state requires a massive injection of 7,990 new social dwellings annually for the next decade just to achieve parity with the national average. [1, 2, 3, 9, 10]
[3] https://www.miragenews.com
[4] https://www.realestate.com.au
[5] https://newshub.medianet.com.au
[6] https://www.miragenews.com
[7] https://www.miragenews.com
[8] https://www.miragenews.com
[10] https://chp.org.au
Public-Private Partnerships (PPPs) offer a structured mechanism for governments to deliver large-scale infrastructure by transferring specific risks to the private sector. However, they are highly complex financial arrangements that come with long-term fiscal trade-offs.
The Pros (Benefits)
- Risk Transfer: The private consortium assumes the financial risk of construction delays, budget overruns, and ongoing asset degradation, shielding taxpayers from unexpected costs.
- Off-Balance-Sheet Financing: Governments can initiate critical, multi-billion-dollar infrastructure projects immediately without a massive, upfront spike in public capital debt.
- On-Time and On-Budget Delivery: Private consortia face harsh financial penalties or reduced state service payments if they miss construction deadlines, driving higher project efficiency.
- Guaranteed Long-Term Maintenance: Because the private partner must hand back the asset in pristine condition at the end of the contract (e.g., 40 years), they are incentivized to use high-quality materials and perform regular maintenance.
- Innovation and Efficiency: Private companies utilize specialized, cutting-edge technology and operational practices that are often difficult to implement under rigid bureaucratic frameworks.
The Cons (Drawbacks)
- Higher Long-Term Costs: Private entities borrow money at higher interest rates than governments. This added cost, combined with the partner’s profit margin, can make the project more expensive over its lifespan than traditional public procurement.
- Inflexible, Decades-Long Contracts: PPP agreements lock governments into rigid terms for 20 to 50 years. Adapting the infrastructure to unforeseen societal changes or new technologies can trigger exorbitant contract modification fees.
- Diluted Public Accountability: When critical services (like public housing or toll roads) are managed by private entities, public transparency decreases. Commercial-in-confidence clauses frequently hide financial details from public scrutiny.
- Risk of Private Partner Insolvency: If the private consortium goes bankrupt mid-contract (as seen globally with major construction firms), the government is forced to step in, rescue the project, and absorb massive financial losses.
- Profit Motive vs. Public Interest: Private operators naturally prioritize financial returns. This can lead to cost-cutting on frontline service delivery, high user tolls, or stricter tenant eligibility criteria to minimize operational risks.
Over the last 10 years (2016–2026), Victoria’s social housing performance has been characterized by significant new construction offset by aggressive demolitions, resulting in low net stock growth relative to population demand. While the $5.3 billion Big Housing Build (BHB) initiated in 2020 boosted construction activity, a prolonged period of “managed decline” and asset disposal kept net gains minimal for the first half of the decade. [1, 2, 3, 4]
The 10-Year Stock Trajectory (Total Dwellings)
Despite thousands of physical builds commencing, the net gain of available dwellings has been a bottleneck due to old stock subtractions: [1, 5]
- 2018 Stock: 86,813 dwellings
- 2022 Stock: 86,887 dwellings (Net gain of just 74 homes over 4 years)
- 2024 Stock: 89,501 dwellings (BHB completions beginning to register)
- 2025 Stock: 91,068 dwellings (Most recent official DFFH Annual Report figures) [1, 2, 5]
Old vs. New Dwelling Churn: A 12-Month Snapshot (2024–25)
To see why the total availability crawls forward slowly, the data from the DFFH 2024–25 Machine Readable Dataset illustrates the dynamic between new builds and old stock destruction:
- New Additions (Total: +2,392 dwellings)
- New Handovers (Builds): +1,616
- Market Acquisitions: +655
- New Short-Term Leases: +107
- Old Subtractions (Total: -825 dwellings)
- Demolitions (Old Stock): -491
- Short-Term Lease Handbacks: -146
- Community Disposals/Sales: -188
- Net Annual Yield: +1,567 available dwellings [5]
Key Performance Insights
- The Demolition Bottleneck: To build modern, energy-efficient estates under Public-Private Partnerships like the Ground Lease Model (GLM), older concrete “walk-up” flats and towers must be entirely cleared. This causes large tranches of old public stock to go offline for years before the replacement dwellings open.
- Market Share Slippage: Even though total stock grew from roughly 86,000 to over 91,000 homes in ten years, Victoria’s population outpaced this pipeline. Social housing fell from 3.6% of the state’s total housing market in 2011 down to 3.2% by 2026, making it the lowest proportional safety net in Australia.
- The Waitlist Pressure: While old stock was being substituted for new builds, the Victorian Housing Register waitlist grew by 45%, leaving over 65,000 people waiting for available keys.
- Recent Funding Adjustments: Acknowledging the deficit, the government announced an additional $860 million investment in 2026 targeting a pipeline of 7,000 extra social housing properties over the coming decade to offset ongoing structural losses. [1, 2, 5, 6, 7, 8, 9, 10, 11]
[1] https://www.theguardian.com
[2] https://www.parliament.vic.gov.au
[5] https://www.dffh.vic.gov.au
[6] https://impact.launchhousing.org.au
[8] https://www.tandfonline.com


Leave a Reply