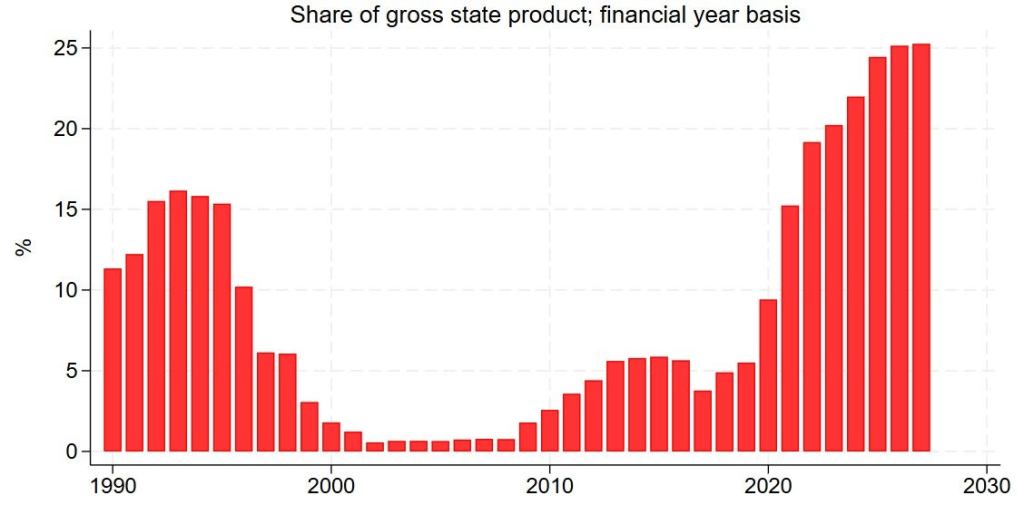
Victoria’s state debt is the largest in Australia and is projected to reach around 25% of Gross State Product this year. Interest payments alone are expected to rise to 9% of the state budget by 2028. Borrowing to fund infrastructure is both normal and necessary. Before the “Big Build”, Victoria had underinvested in infrastructure following the last period of debt reduction.
However, a significant portion of the current debt—around $50 billion—reflects operating losses accumulated over the past six years. This distinction matters. Using debt to invest in long‑term assets is like taking out a mortgage to buy a house or a car: it builds capacity and value. Using debt to cover day‑to‑day expenses is different—it is akin to borrowing against your mortgage to pay for groceries, which signals living beyond your means.
The problem is compounded by cost overruns, estimated at approximately $3.3 billion, which further increase the debt burden without delivering corresponding benefits.
The government must outline its concrete plans to reduce the debt more quickly, as we enter a period of huge international instability. The continued over-reliance on Stamp Duty should end, see Abolish Stamp Duty.
Generated by Google, prompted by me.
Victoria currently carries the highest debt burden of any Australian state, both as a share of its economy and in its impact on the annual budget. [1, 2, 3]
Debt as a Share of Economy (% GSP) [4]
Victoria’s net debt as a percentage of Gross State Product (GSP) is significantly higher than that of other major states. [4]
- Victoria: Projected to peak at 25.2% in 2026–27.
- New South Wales: Forecast to reach approximately 13.7%–14% by 2026.
- Queensland: Forecast to remain much lower, around 7.5%–8%.
- National Average (States): The average net debt for all Australian states is roughly 13.8% of GDP. [5, 6, 7, 8, 9]
📉 Debt as a Share of Government Spending [10, 11]
The cost of servicing this debt (interest payments) is consuming a growing portion of Victoria’s total annual expenditure, limiting funds for services. [12]
- Interest Bill: Interest payments are forecast to reach $7.7 billion in 2025–26, rising to $10.5 billion by 2028–29.
- Spending Share: By 2028, interest is expected to account for 9% of total state expenditure, up from roughly 6.5% in 2025.
- Comparison: Victoria’s interest expenses absorb approximately 7% of its revenue, the highest rate in Australia, compared to a state average of roughly 5%. [13, 14, 15, 16, 17]
🏛️ Comparison Summary (2025–26 Forecasts)
| Metric [8, 13, 17] | Victoria | NSW | QLD | WA |
|---|---|---|---|---|
| Net Debt ($B) | ~$166B | ~$115B | ~$39B | ~$19B |
| Net Debt % GSP | ~24.6% | ~13.7% | ~7.8% | ~4.5% |
| Interest % Revenue | ~7.0% | ~5.0% | ~3.0%* | ~1.0%* |
📌 Key Point: Victoria’s debt as a share of the economy is nearly double that of New South Wales and triple that of Queensland. [5, 8]
[3] https://jamesnewbury.com.au
[4] https://adepteconomics.com.au
[11] https://ipa.org.au
[13] https://adepteconomics.com.au
[14] https://www.afr.com
[15] https://vic.liberal.org.au
[17] https://adepteconomics.com.au
The significant rise in Victoria’s public sector debt, projected to reach $194 billion by 2028–29, is driven by a combination of pandemic-era emergency spending, a massive infrastructure program, and rising borrowing costs. [1, 2]
🏥 COVID-19 Pandemic Response
The pandemic is a primary driver, adding an estimated $31.5 billion in direct debt. [3, 4]
- Emergency Handouts: Significant borrowing was required for business support grants, hotel quarantine, and health system surges.
- Revenue Loss: Extended lockdowns led to sharp declines in taxation revenue, forcing the state to borrow to cover basic operating costs.
- Repayment Plan: A 10-year COVID Debt Repayment Plan is currently in place, funded by temporary payroll and land tax levies. [4, 5, 6, 7, 8]
🏗️ “Big Build” Infrastructure Program
The Victorian government has pursued an aggressive infrastructure agenda that has consistently outpaced the state’s revenue growth. [9, 10]
- Project Scale: Massive investments in the Metro Tunnel, North East Link, and Suburban Rail Loop have driven debt higher.
- Cost Overruns: Major projects have suffered billions in blowouts due to labor shortages and rising material costs.
- Shift in Investment: Historically, Victoria invested 1% of its economy in capital works; after 2017, this jumped to over 2.5% of GSP. [10, 11, 12, 13]
📈 Structural & Economic Factors
Beyond one-off events, several structural issues keep the debt growing: [14]
- Rising Interest Rates: Servicing the debt is becoming more expensive; interest payments are forecast to exceed $10 billion annually by 2028.
- Public Sector Wages: Employee expenses have grown roughly 8.5% per year since 2014, consistently exceeding initial budget forecasts.
- Slowing Revenue: Softer-than-expected employment and property market outcomes have recently led to shortfalls in payroll and land tax collections. [9, 13, 15, 16, 17]
📊 Summary of Debt Drivers
| Factor [2, 4, 13, 18, 19, 20] | Primary Impact | Context |
|---|---|---|
| COVID-19 | ~$31.5B direct debt | Includes health response and business relief. |
| Infrastructure | ~$16B+ annual spend | “Big Build” projects like Metro Tunnel and SRL. |
| Interest Costs | ~$28M per day | Costs increasing due to higher global interest rates. |
| Public Service | 52% of budget spend | Employee expenses frequently outrun budget limits. |
[1] https://vic.liberal.org.au
[3] https://www.dtf.vic.gov.au
[4] https://www.2023.budget.vic.gov.au
[6] https://www.businessthink.unsw.edu.au
[7] https://www.victorianchamber.com.au
[8] https://www.audit.vic.gov.au
[10] https://e61.in
[11] https://ipa.org.au
[13] https://www.macrobusiness.com.au
[14] https://www.theguardian.com
[15] https://www.pitcher.com.au
[16] https://yieldreport.com.au
[17] https://vic.liberal.org.au
[18] https://www.parliament.vic.gov.au
[20] https://www.liberalvictoria.org.au
Victoria‘s investment in capital works is the highest in Australia as a share of its economy, largely driven by the “Big Build” program.
🏗️ Capital Expenditure as % of State Economy (GSP)
Victoria spends a significantly higher proportion of its Gross State Product (GSP) on infrastructure than any other state.
- Victoria: ~2.7% of GSP
- New South Wales: ~1.7% of GSP
- Western Australia: ~1.5% of GSP
- Queensland: ~1.4% of GSP
Annual Capital Spend Comparison (Approx. 2024-25 Estimates)
While NSW has a larger total economy, Victoria’s annual cash outlay for infrastructure projects has frequently matched or exceeded it in recent years.
- Victoria: ~2.7% of GSP
- New South Wales: ~1.7% of GSP
- Western Australia: ~1.5% of GSP
- Queensland: ~1.4% of GSP
⚖️ Investment Intensity vs. Fiscal Capacity
The “intensity” of Victoria’s investment is what distinguishes it from its peers:
- Project Density: Victoria is managing multiple “mega-projects” simultaneously, such as the Suburban Rail Loop and the North East Link.
- Debt Funding: Unlike Western Australia or Queensland, which have used mining royalties to fund portions of their capital works, Victoria’s program is almost entirely debt-funded.
- Cost Escalation: Due to the sheer volume of work, Victoria faces higher internal competition for labor and materials, contributing to higher cost-overrun risks compared to states with more spread-out pipelines.
📉 Recent Moderation
In the most recent budget, the Victorian government announced a move to “re-profile” (delay) some projects to manage the debt burden, whereas states like Queensland are currently increasing spend ahead of the 2032 Olympics.
The Victorian government uses debt for two distinct purposes: financing long-term infrastructure (the “Big Build”) and covering ongoing operating losses (recurrent spending). [1, 2, 3]
🏗️ Debt for Infrastructure
The majority of Victoria’s current debt growth is driven by its capital program.
- Primary Driver: Over 80% of new borrowing in recent years has been linked to the State’s capital program.
- Investment Levels: Infrastructure spending peaked at approximately $24 billion in 2023–24.
- Project Impacts: Much of this debt is tied to multi-billion dollar “mega-projects” such as the Metro Tunnel, North East Link, and the Suburban Rail Loop.
- Cost Overruns: Rising material and labour costs have led to billions in unplanned debt, with major project blowouts currently totalling around $3.3 billion. [4, 5, 6, 7]
🏥 Debt for Operating Costs
While governments typically aim to fund daily operations from revenue, Victoria has recently relied on debt to cover operating deficits. [1]
- Accumulated Losses: Over the six years leading into 2025, Victoria has accumulated more than $50 billion in operating losses.
- Recurrent Spending: A portion of the state’s debt—roughly $16.5 billion—is attributed to the ongoing cost of providing public services such as health and education.
- Interest Burden: As debt grows, interest payments (a recurrent operating cost) are consuming a larger share of the budget, forecast to reach $10.6 billion annually by 2028–29.
- Employee Costs: Roughly 40% of the state’s operating budget is dedicated to public sector employee expenses, which have consistently grown faster than initial budget targets. [1, 2, 8, 9, 10]
⚖️ Comparison Summary
| Category [11] | Typical Annual Spend | Status |
|---|---|---|
| Infrastructure | ~$22B – $24B | Main driver of total debt; current focus on “re-profiling” (delaying) projects. |
| Operating Result | Variable (Deficit) | Significant reliance on debt since 2019; government targeting return to surplus by 2025–26. |
[2] https://vic.liberal.org.au
[4] https://www.dtf.vic.gov.au
[8] https://www.audit.vic.gov.au
[9] https://www.businessthink.unsw.edu.au
[10] https://e61.in
To manage record debt levels while maintaining its “Big Build” agenda, the Victorian Government has introduced a multi-pronged strategy focused on a 10-year repayment plan, significant public sector job cuts, and the delay of several major projects. [1, 2, 3, 4]
🛡️ The COVID Debt Repayment Plan
Introduced in the 2023–24 Budget, this 10-year plan aims to repay $31.5 billion in pandemic-related debt by 2033. Key measures include: [5, 6, 7, 8]
- COVID Debt Levy (Payroll): A temporary surcharge for businesses with national payrolls over $10 million (0.5%) and over $100 million (an additional 0.5%).
- COVID Debt Levy (Landholdings): A temporary increase in land tax for 10 years, which includes lowering the tax-free threshold from $300,000 to $50,000.
- Victorian Future Fund (VFF): Established to help manage debt, the fund is supported by proceeds from the VicRoads modernisation venture and future government land sales. [5, 7, 9, 10, 11]
✂️ Public Sector Consolidation & Job Cuts
Following the Silver Review (2025), the government is aggressively “rightsizing” the public service to return it to pre-pandemic levels. [12, 13]
- Workforce Reductions: Targeted cuts of up to 3,000 roles across the public service have been announced to reduce the state’s wages bill.
- Executive Cuts: A specific reduction of 332 executive roles is expected to save $359 million.
- Agency Consolidation: The number of public entities is being reduced by 29 (with a goal to halve business regulators by 2030) to eliminate duplication and “cut fat”.
- Consultant Reductions: A mandate to further reduce expenditure on consultants and labour hire by 10%. [3, 13, 14]
⏳ Infrastructure “Re-profiling” (Delays)
To manage immediate cash flow and address labour shortages, the government has delayed several high-profile projects: [1, 15]
- Melbourne Airport Rail Link: Delayed by at least four years.
- Level Crossing Removals: Projects on the Upfield line (Brunswick) pushed back to 2030.
- Mental Health Clinics: Rollout of 35 walk-in clinics delayed due to the inability to find 2,500 required staff. [1, 15]
📊 Long-term Fiscal Strategy
The government’s path to “budget restoration” follows a defined 5-step process: [4, 12, 16]
- Step 1: Create jobs and restore economic growth.
- Step 2: Return to an operating cash surplus.
- Step 3: Return to operating surpluses (Projected for 2025–26).
- Step 4: Stabilise net debt levels as a proportion of GSP.
- Step 5: Reduce net debt as a proportion of GSP. [4, 17]
[2] https://www.audit.vic.gov.au
[5] https://www.sro.vic.gov.au
[6] https://annualreview2324.sro.vic.gov.au
[8] https://www.gazette.vic.gov.au
[10] https://www.tickboxconveyancing.com.au
[11] https://www.2023.budget.vic.gov.au
[14] https://www.weareunion.org.au
[16] https://www.budget.vic.gov.au
Victoria’s expenditure profile is dominated by Health and Education, which together account for more than half of the state’s total spending. [1]
📊 Top 5 Expenditure Items (% of Total Spending)
Victoria allocates a higher proportion of its budget to Health and Education than its peers, while Public Order and Safety remains a significant cost center across all three states. [1]
| Expenditure Item [1, 2, 3] | Victoria (VIC) | New South Wales (NSW) | Queensland (QLD) |
|---|---|---|---|
| Health | 31% | ~28% | ~26% |
| Education | 25% | ~24% | ~22% |
| Public Order & Safety | 12% | ~11% | ~11% |
| Transport | 9% | ~10% | ~10% |
| General Public Services | 10% | ~8% | ~9% |
Note: Figures are based on 2024–25 budget estimates and 2025 financial reports using COFOG-A classifications. [4, 5, 6]
🔍 Comparative Insights
- Health Dominance: Victoria’s health spending (31%) is the highest in the country by share, partly driven by the continued rollout of mental health reforms and hospital infrastructure improvements.
- Infrastructure Intensity: While not always in the “Top 5” of daily operating expenses, Victoria’s capital program (infrastructure) accounts for 16.1% of total general government expenditure, higher than NSW (~12%) and QLD (~14%).
- Wages and Interest: Victoria’s “General Public Services” category (10%) is slightly higher than peers, reflecting a larger relative spend on public servant wages and the state’s growing interest bill, which is the highest in Australia.
- Education Investment: Victoria maintains the highest share of spending on education at 25%, supported by the Free Kinder program and universal Three-Year-Old Kinder reforms. [2, 4, 5, 7, 8, 9]
[2] https://infrastructure.org.au
[4] https://www.audit.nsw.gov.au
[8] https://adepteconomics.com.au
[9] https://s3.ap-southeast-2.amazonaws.com
Victoria’s net debt as a proportion of Gross State Product (GSP) has moved through a dramatic “U-shape” curve over the last 50 years, hitting historical lows in the 2000s before climbing to record modern peaks. [1, 2, 3]
The state’s debt-to-GSP trajectory can be broken down into four distinct fiscal eras:
1. The Early 1990s Economic Collapse (10% to 16% of GSP) [4]
- The Environment: Following the late 1980s economic boom, the State Bank of Victoria collapsed, sending the state into a deep recession.
- The Ratio Peak: General government net debt rose rapidly under the Cain and Kirner Governments, peaking at just over 16% of GSP in 1992–93. At the time, this level of debt triggered a state financial crisis, leading to a downgrade of Victoria’s triple-A credit rating. [1, 2, 5, 6, 7]
2. Privatisation, Surpluses, and Elimination (1993 to 2014: 16% down to <1% of GSP)
- The Kennett Debt Elimination (1990s): The incoming Liberal Government implemented aggressive fiscal consolidation. By selling off the state’s electricity, gas, and tram infrastructure, the government used privatization proceeds to pay down the state’s debt pile, driving the net debt-to-GSP ratio down sharply.
- The Bracks/Brumby Surpluses (2000s): The subsequent Labor Governments maintained a strict fiscal strategy that legally mandated running cash operating surpluses. Up until the 2008 Global Financial Crisis (GFC), Victoria effectively eliminated its structural net debt, tracking close to 0% to 3% of GSP for over a decade. [8]
3. The Infrastructure “Big Build” Era (2015 to 2019: 4% to 6% of GSP)
- The Shift: Following the election of the Andrews Government, Victoria shifted its economic model toward debt-funded, large-scale public transport and road infrastructure investments (e.g., Level Crossing Removals, Metro Tunnel).
- The Ratio: Because the global interest rate environment was exceptionally low, the state comfortably absorbed this borrowing. Net debt rose in absolute terms to around $25 billion but remained highly stable as a proportion of the growing economy, tracking between 4.5% and 6% of GSP. [1]
4. COVID-19 and Modern Escalation (2020 to 2026+: 10% to 25.2% of GSP)
- The Spike: The combined impact of emergency pandemic health spending, extended economic lockdowns, and compounding cost overruns on major infrastructure pipelines caused state borrowing to grow rapidly. [1, 9]
- The Current Peak: Victoria’s net debt-to-GSP ratio surpassed its 1990s recession peak. State financial updates confirm net debt is tracking at roughly 25% of GSP and is projected by the Victorian Parliamentary Budget Office (PBO) to peak at 25.2% of GSP. [1, 2, 5, 9, 10]
Macro Historical Snapshot Matrix
| Fiscal Era / Anchor Points [1, 2, 5, 6, 8, 9, 10] | Approximate Net Debt ($AUD) | Net Debt as % of GSP | Economic Driver |
|---|---|---|---|
| 1970s–1980s Baseline | < $5 Billion | ~5% to 8% | Stable state infrastructure ownership |
| 1992–93 Recession Peak | $18.8 Billion | 16.1% | State Bank collapse & deep recession |
| 2005–06 Gold Standard | ~ $0.5 Billion | < 1.0% | Structural privatization & cash surpluses |
| 2018–19 Pre-Pandemic | $25.3 Billion | 5.4% | Early “Big Build” transport rollout |
| 2025–26 Modern Peak | $167+ Billion | 25.0% – 25.2% | Post-COVID borrowing & infrastructure drawdowns |
[1] https://e61.in
[4] https://e61.in
[5] https://www.audit.vic.gov.au
[6] https://vgls.sdp.sirsidynix.net.au


Leave a Reply