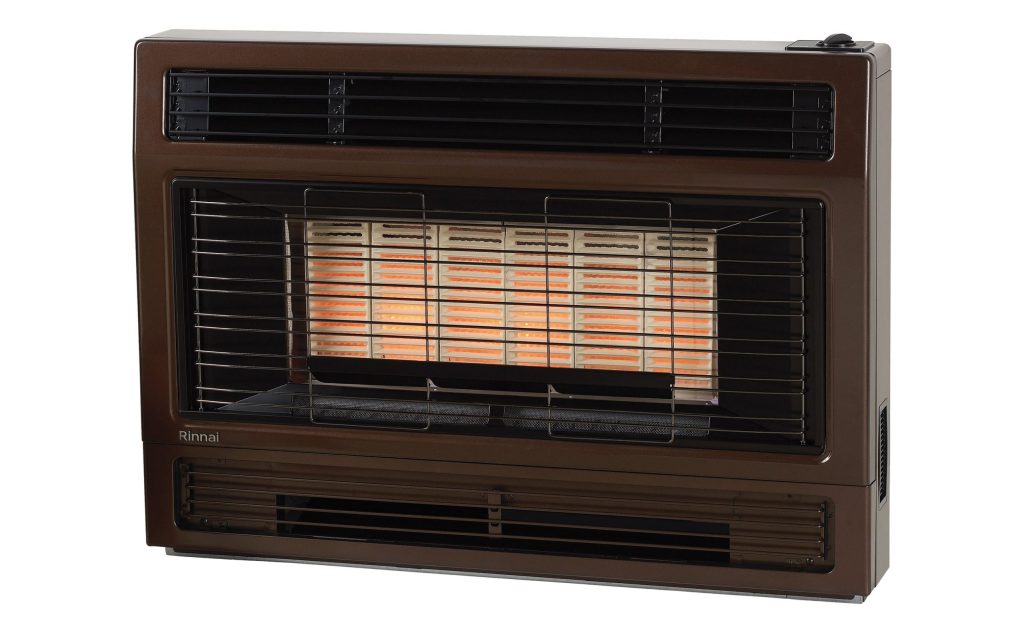
Despite Victoria’s brown coal legacy, ~42% of power is now from renewables. That means Victorians enjoy lower electricity prices. But the high reliance on gas for heating means not everyone is enjoying lower energy bills.
The policy settings are in place for 2 million households to pivot off gas for home heating and cooking. The government needs to simplify and communicate incentives to replace gas appliances and ensure these are means-tested to target those most in need. Low-income households, renters, and apartment dwellers risk being stuck on decaying (gas) networks they cannot afford to exit. More middle-class welfare is not the solution.
1. Make Electrification Simple and Accessible
- One-stop electrification program
Create a single, easy-to-navigate platform that bundles all rebates, financing, and installation support for:- Heat pump hot water
- Reverse-cycle heating/cooling
- Induction cooking
- Upfront discounts, not complex rebates
Shift from after-the-fact rebates to instant, point-of-sale discounts to remove cost barriers.
2. Target Support to Those Most in Need
- Means-tested subsidies (up to 100%)
Fully fund electrification upgrades for:- Low-income households
- Pensioners and concession card holders
- Priority transition zones
Target suburbs with high gas use and high energy hardship for accelerated rollout. - No-interest financing for middle-income households
Enable zero upfront cost repayment through energy bills or council rates.
Victoria has made strong progress on renewable electricity—but gas is now the weak link in household energy affordability.
This policy ensures that:
- Everyone—not just homeowners—can access lower energy bills
- The transition is fair, simple, and affordable
- Vulnerable households aren’t trapped on expensive, declining gas networks
Google Q&A
Victoria’s energy mix is currently in a state of rapid transition. While the state has historically relied on brown coal, it has recently surpassed its interim renewable energy targets, now outperforming larger states like New South Wales and Queensland in renewable share. [1, 2, 3, 4, 5]
⚡ Electricity Generation by State (2024-25 Estimates) [6]
Victoria currently holds a “middle-ground” position: it remains more coal-dependent than South Australia and Tasmania, but is significantly more advanced in its renewable transition than Western Australia or Queensland. [7, 8]
| State [4, 9, 10, 11, 12] | Renewables % | Fossil Fuels % | Primary Fuel Source |
|---|---|---|---|
| Tasmania | ~95.8% | ~4.2% | Hydro |
| South Australia | ~74.3% | ~25.7% | Wind / Solar / Gas |
| Victoria | ~42.4% | ~57.6% | Brown Coal |
| NSW | ~36.8% | ~63.2% | Black Coal |
| Queensland | ~28.6% | ~71.4% | Black Coal |
| WA | ~19.4% | ~80.6% | Natural Gas |
🔍 Key Distinctions in Victoria’s Mix
1. The “Brown Coal” Legacy
Unlike NSW and Queensland, which use black coal, Victoria relies on brown coal (lignite). [13, 14, 15, 16]
- Efficiency: Brown coal is less efficient and more carbon-intensive than black coal.
- Concentration: Most of this generation is concentrated in the LaTrobe Valley.
- Phase-out: Coal’s share has dropped from ~85% in 2008 to under 60% today. [13, 17, 18, 19, 20]
2. High Domestic Gas Reliance
Victoria is an outlier in its consumption of natural gas, particularly for home heating. [21]
- Household Use: Victorian homes rely on gas far more than any other state.
- Industrial Input: Roughly 31% of the state’s gas is used by manufacturing and industry.
- Policy Shift: To combat local shortages, the state government has introduced bans on new gas connections for homes to force a shift toward electrification. [21, 22, 23]
3. Renewable Growth & Battery Storage
Victoria is scaling renewables faster than the national average. [24]
- Wind Power: Wind is Victoria’s largest renewable source (~21.8%), with significant future capacity planned for offshore wind in the Gippsland region.
- Solar Record: Victoria recently set a record for half-hourly renewable generation, reaching 82.5% on 16 October 2025.
- Batteries: Victoria was a leader in utility-scale batteries (e.g., the Victorian Big Battery), though NSW has recently overtaken it in single-day battery discharge capacity. [11, 24, 25, 26]
💡 Proactive Tip: If you’re looking at future energy costs, Victoria’s forward electricity prices have remained elevated compared to NSW due to recent coal plant outages at stations like Yallourn. [27]
[1] https://www.energy.vic.gov.au
[4] https://solarcalculator.com.au
[6] https://www.energy.vic.gov.au
[8] https://www.theguardian.com
[10] https://solarcalculator.com.au
[11] https://www.parliament.vic.gov.au
[15] https://solarcalculator.com.au
[16] https://world-nuclear.org
[19] https://wwfint.awsassets.panda.org
[20] https://www.energyfactsaustralia.org.au
[21] https://www.vivaenergy.com.au
[23] https://environmentvictoria.org.au
[25] https://www.energycouncil.com.au
[26] https://reneweconomy.com.au
[27] https://wattutilities.com.au
Victoria currently offers some of the most competitive energy prices in Australia, largely driven by its high integration of renewable energy and efficient brown coal generation. As of early 2026, Victoria consistently has the lowest wholesale electricity prices in the National Electricity Market (NEM). [1, 2]
🏭 Production Costs (Wholesale Prices)
Victoria’s wholesale electricity prices (the cost to produce and sell to the grid) are the lowest among the major mainland states. [2]
- Quarterly Average (Q4 2025): Victoria’s wholesale price was $37/MWh, matching South Australia for the lowest on the mainland.
- Comparison: This is significantly lower than New South Wales ($75/MWh) and Queensland ($58/MWh), which remain more dependent on higher-cost black coal.
- Driving Factors: High renewable output and a record number of negative-priced periods (where there is more power than demand) have pushed Victorian production costs down. [1, 3, 4]
🏠 Prices to Consumers (Household Bills)
While wholesale prices are low, the final price to consumers includes network charges, retail costs, and taxes. Victoria remains one of the cheapest states for residential electricity. [5, 6]
| State [7, 8, 9, 10] | Average Quarterly Bill (2025-26) | Avg. Rate per kWh |
|---|---|---|
| Victoria | $368 – $418 | 25c – 26c |
| NSW | $452 – $593 | 28c – 35c |
| South Australia | $433 – $575 | 32c – 38c |
| Queensland | $389 – $535 | 26c – 30c |
(Data compiled from Canstar, Compare the Market, and Econnex 2025-26 forecasts.)
- The Victoria Advantage: Victorian households pay the lowest rates on average, with the Victorian Default Offer (VDO) seeing only a 1.2% increase for 2025-26, compared to nearly 10% increases in NSW.
- Usage Patterns: Victorians often have lower electricity bills partly because they use less electricity on average (approx. 4,950 kWh/year) compared to NSW (5,800 kWh/year), largely due to the high use of gas for heating. [6, 7, 11, 12]
⛽ Gas Prices: The Critical Difference
While electricity is cheaper, Victoria is unique in its heavy reliance on gas. [6]
- Lowest Gas Rates: Victoria generally has the lowest gas prices in Australia (approx. $12.19 – $12.26 per GJ), as it is the hub for southern gas production and storage.
- Transition Risk: Despite lower unit prices, the state’s total energy bills can be high in winter because Victorians consume more gas than any other state. The government’s move to ban new gas connections is aimed at shifting this consumption to the cheaper renewable electricity grid. [4, 12, 13, 14]
💡 Proactive Tip: To find the best current deal in Victoria, use the Victorian Energy Compare tool—it is the only independent site that covers every available offer in the state. [15]
[2] https://www.energy.vic.gov.au
[5] https://www.energy.vic.gov.au
[7] https://www.econnex.com.au
[9] https://www.canstar.com.au
[10] https://www.comparethemarket.com.au
[12] https://www.bluettipower.com.au
[15] https://services.dffh.vic.gov.au
Victoria has a distinct gas profile: it features the lowest usage rates (price per unit) in Australia, but the highest total consumption, resulting in some of the highest annual bills in the country. [1, 2]
📊 Gas Usage and Cost by State (2025–26)
| State [3, 4, 5, 6] | Avg. Annual Bill | Avg. Usage Rate | Avg. Annual Usage |
|---|---|---|---|
| Victoria | $1,320 – $2,240 | ~3.1c – 3.8c / MJ | ~50,000 – 60,000 MJ |
| NSW | $820 – $972 | ~4.3c – 5.2c / MJ | ~18,000 – 20,000 MJ |
| South Australia | $848 – $1,170 | ~5.2c – 5.5c / MJ | ~16,000 MJ |
| Queensland | $796 – $916 | ~3.9c – 5.2c / MJ | ~7,000 – 9,000 MJ |
| Western Australia | $684 | ~4.0c – 4.5c / MJ | ~14,000 MJ |
Sources: Canstar, Finder, Arcline by RACV, and Electricity Provider. [7]
🔍 Key Comparative Insights
1. The “High Usage” Paradox
Victoria has the lowest unit price for gas in Australia (often under 4c/MJ), yet Victorians often pay the highest annual bills. [8, 9]
- Why? Roughly 90% of Victorian homes are connected to gas—the highest rate in the country.
- Heating Demand: Victorians use gas heavily for space heating during winter, consuming nearly half of their annual gas in that single season alone. [10, 11]
2. Declining Consumption Trends
Despite historically high usage, Victorian gas consumption is falling as residents shift toward all-electric homes.
- Usage Drop: Average annual usage per home in Victoria has fallen by over 24% since 2020.
- New Builds: As of mid-2025, over 90% of new Victorian residential approvals are for all-electric homes with no gas connection. [12]
3. Regional Price Volatility
Gas costs in Victoria are subject to seasonal “winter premiums.”
- Wholesale Spikes: In 2026, Victorian futures are pricing a $3/GJ premium for winter supply compared to summer, reflecting the continued decline of local southern gas production.
- Retail Stability: Despite wholesale volatility, Melbourne’s retail gas price changes in 2025/26 have been “middle of the field” compared to other capital cities. [13, 14]
💡 Proactive Tip: For Victorians, switching from a gas-and-electric “dual-fuel” home to a fully electric home with solar can save approximately $1,230 to $2,230 per year on total energy bills. [12]
[1] https://www.electricityprovider.com.au
[2] https://www.canstar.com.au
[3] https://www.electricityprovider.com.au
[4] https://www.myconnect.com.au
[5] https://www.electricityprovider.com.au
[6] https://www.canstar.com.au
[11] https://www.comparethemarket.com.au
[12] https://www.energy.vic.gov.au
[14] https://shellenergy.com.au
Victoria is currently Australia’s “engine room” for renewable energy growth. While South Australia remains the leader in percentage share, Victoria has the highest utility-scale renewable output on the east coast and some of the most competitive pricing due to its high density of wind and solar farms.
⚡ Renewable Usage by State (2025–26)
Victoria has consistently met and exceeded its interim targets, now providing nearly half of the state’s electricity via renewable sources.
| State | Renewable Share of Generation | Primary Renewable Source |
|---|---|---|
| South Australia | ~75% | Wind / Rooftop Solar |
| Victoria | ~42% – 45% | Wind (22%) / Solar (15%) |
| New South Wales | ~37% | Solar / Wind |
| Queensland | ~29% | Solar |
| Tasmania | ~96% | Hydro |
- Wind Dominance: Victoria is Australia’s largest producer of wind energy by total megawatt-hours (MWh).
- The “Big Battery” Effect: Victoria leads in large-scale storage capacity (e.g., the Victorian Big Battery), which allows it to “use” more of its renewable energy rather than exporting it or curtailing it.
💰 Cost Comparison: The “Renewable Discount”
Victoria currently experiences more hours of zero or negative wholesale prices than any other state in the National Electricity Market (NEM) due to its high renewable penetration.
Wholesale Level (Production)
- Victorian Wholesale Avg: $37/MWh (Q4 2025).
- Impact: When the wind is blowing and the sun is shining, Victoria’s wholesale prices often drop to $0, effectively subsidising the overall quarterly average.
- Comparison: NSW and QLD, which have less wind and more coal, typically maintain higher averages ($55–$75/MWh) because they cannot “switch off” coal as easily as Victoria can ramp up wind.
Consumer Level (Feed-in Tariffs)
While production is cheap, the “reward” for households with solar panels (Feed-in Tariffs or FiTs) is lower in Victoria than in most other states because the market is so saturated with solar energy during the day.
| State | Avg. Solar Feed-in Tariff (FiT) |
|---|---|
| Victoria | 3.3c – 4.9c per kWh (Standard) |
| NSW | 5.0c – 10.0c per kWh |
| Queensland | 5.0c – 12.0c per kWh |
| South Australia | 5.0c – 8.0c per kWh |
🚀 Future Outlook: Offshore Wind
Victoria is the only state currently building a legislative framework for Offshore Wind, specifically in the Gippsland and Portland regions.
- Cost Projection: While initial construction costs are high, offshore wind provides a more consistent “baseload” style of renewable energy compared to onshore wind, potentially stabilising Victorian prices further in the 2030s.
💡 Proactive Tip: If you have solar in Victoria, the low daytime feed-in tariffs mean you get the best value by “load shifting”—running your dishwasher, dryer, and EV charger between 10 am and 2 pm rather than selling power back to the grid.
Victoria is the epicentre of Australia’s gas-to-electric transition, using the state’s updated Gas Substitution Roadmap to systematically move its two million gas-reliant households off the fossil fuel network. [1, 2]
The transition framework has been explicitly restructured for 2026 to balance consumer costs with grid stability as network operator Citipower flags peak winter demand jumps. [3]
🏛️ 1. Legislative Mandates & Timelines
The Victorian Government has established rigid checkpoints to phase out new and existing residential gas infrastructure. [4]
- New Dwellings: Any new home requiring a local planning permit must be constructed as fully electric. Piped natural gas is completely prohibited for these developments, though bottled LPG remains exempt. [5, 6]
- The 2027 Expansion: Starting 1 January 2027, broader building regulations come into effect. These will completely ban gas connections across all remaining new residential builds and most new commercial developments. [4, 6]
- Rental Property Caps: Landlords face phased-in, stricter energy efficiency rules starting in 2027. These will legally require the upgrading of failing systems to efficient electric appliances. [6, 7]
💰 2. Victorian Rebates & Subsidy Stacking
The financial mechanics of upgrading gas infrastructure depend on stacking three primary state and federal incentives: [8]
| Incentive Layer [8, 9, 10, 11, 12] | Program / Body | Maximum Financial Subsidy | Core Constraints / Rules |
|---|---|---|---|
| State Hot Water Rebate | Solar Victoria | $1,000 standard or $1,400 for locally-made models | Crucial 2026 Change: Income cap drops from $210k to $150k on 1 July 2026. Property value under $3M. |
| Energy Savings Discount | Victorian Energy Upgrades (VEU) | $560 to $910 upfront point-of-sale voucher | No income test. Building must be 2+ years old. Requires replacing an active, inefficient gas asset. |
| Federal Environmental Credits | Small-scale Technology Certificates (STCs) | $300 to $600 adjusted by system size | No income test. Calculated dynamically based on your Victorian postcode zone. |
| Space Heating Subsidy | Combined VEU / Heating Program | Up to $2,600 | Specifically for swapping whole-of-house ducted gas networks for multi-head split systems. |
📉 3. The Gas Network “Abolishment” Process
Leaving the grid requires permanent physical disconnection, which is heavily regulated to protect consumers. [2, 6, 13]
- Disconnection vs. Abolishment: Do not request a simple “disconnection”—this merely plugs the meter, leaving the live service pipe active and subject to ongoing network safety tariffs. You must request a meter abolishment through your energy retailer. [13]
- The Price Cap: The Australian Energy Regulator strictly caps physical lines and meter abolishment fees at $220 (plus GST). Gas distributors are legally blocked from charging exorbitant infrastructure removal fees. [6]
- Connection Penalties: To disincentivise network expansion, since January 2025, any consumer attempting to install a new gas link must pay the entire upfront connection capital, completely eliminating historical network-subsidised connection deals. [6]
⚡ 4. Managing Grid Infrastructure Peak Risks
The rapid household transition is rewriting Victoria’s winter power profile. [3]
- Peak Surge: Victorian grid operators report that homes moving fully off gas increase their localized peak winter grid demand by over 250%. [3]
- The Solution: Policymakers are shifting structural incentives to encourage the installation of smart, flexible Consumer Energy Resources (CER). Households are heavily encouraged to time heat pump cycles during the state’s mid-day solar generation peaks via the Victorian Midday Power Saver framework. [14]
[4] https://www.planning.vic.gov.au
[6] https://www.energy.vic.gov.au
[8] https://climategreen.com.au
[9] https://www.energy.vic.gov.au


Leave a Reply