The government should act to:
- ease the supply price impacts of hardwood shortages on building
- future-proof against likely softwood shortages
- drive investment towards higher value-added engineered wood products
Victoria produces around one-quarter of Australia’s total plantation-grown wood. Victoria holds the largest export volume in the country, shipping around 5.3 million m³ of wood products per year. The sector supports over 25,000 jobs (direct and downstream), the largest forestry workforce in Australia,
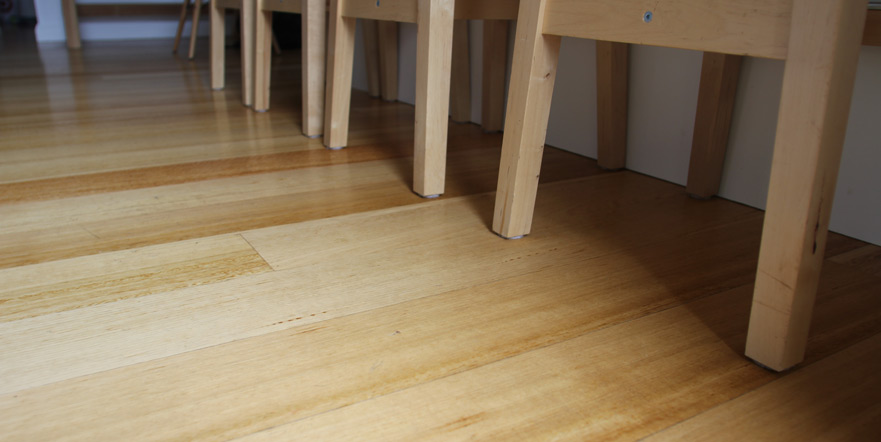
Although Victoria leads the nation in hardwood log production volume (30%), primarily Tasmanian Blue Gum and Shining Gum, there is currently a 20-year deficit in hardwood supply. Victorians may face extreme price spikes for floorboards and furniture as they wait for new plantations to grow. Australia is spending roughly $2 billion extra per year on imported hardwood, often from regions with lower environmental oversight.
ABARES further projects that by 2050, the demand for softwood sawlogs for housing will exceed domestic supply by 3.4 million cubic metres per year.
Australia exports a large volume of raw logs and woodchips while importing high-value engineered wood products (like CLT or LVL).
Background (Google with references)
As of 2024–2026, the Victorian forestry industry has moved into a new era following the cessation of native forest harvesting on 1 January 2024. Despite this shift, Victoria remains a national leader in plantation area and wood processing volume. [1, 2]
📊 State Comparison: Plantation & Production
Victoria holds the largest plantation estate in Australia, providing the backbone for the nation’s timber supply. [1]
| State [3] | Plantation Area (ha) | National Share | Primary Focus |
|---|---|---|---|
| Victoria (VIC) | ~380,700 | ~22% | Largest overall estate; Softwood (pine) & Hardwood (blue gum). |
| New South Wales (NSW) | ~351,600 | ~21% | Largest Softwood estate; significant native harvesting continues. |
| Western Australia (WA) | ~289,300 | ~17% | Focus on hardwood exports and softwood for housing. |
| Tasmania (TAS) | ~271,200 | ~16% | High hardwood volume; active native timber sector. |
| South Australia (SA) | ~163,500 | ~10% | Intensive “Green Triangle” softwood production. |
| Queensland (QLD) | ~205,000 | ~12% | Subtropical pine and native cypress. |
🏗️ Victoria’s Industry Value
While Victoria no longer harvests native timber, its plantation-based sector is a heavy hitter in the national economy. [2, 4]
- Direct Value: The Victorian forest industry generates approximately $5.2 billion in annual output (up to the point of primary processing).
- Log Production: Victoria produces around one-quarter of Australia’s total plantation-grown wood, with the gross value of log production alone valued at $550 million annually.
- Export Leader: Victoria holds the largest export volume in the country, shipping around 5.3 million m³ of wood products per year.
- Employment: The sector supports over 25,000 jobs (direct and downstream), the largest forestry workforce in Australia. [1, 5]
🔄 Strategic Shifts by State
The landscape of Australian forestry is currently defined by different legislative paths:
- Victoria: Entirely plantation-dependent since 2024. Currently investing $190 million into the Gippsland Plantations Investment Program to secure future supply.
- New South Wales: Maintains a dual system of Forestry Corporation NSW (State-owned plantations and native forests) and private growers.
- Tasmania: Recently reaffirmed its commitment to native forest logging, reclassifying 400,000 hectares for “potential production” to compete in the high-value specialty timber market.
- South Australia: Known for its efficiency; the “Green Triangle” region (shared with Victoria) is one of the most productive softwood regions globally, feeding several major domestic mills.
📍 Key Takeaway: Victoria is the “volume and scale” leader of the Australian plantation sector, whereas states like Tasmania and NSW maintain a larger focus on the “specialty” native timber market. [1]
[1] https://agriculture.vic.gov.au
[2] https://www.parliament.vic.gov.au
[3] https://www.agriculture.gov.au
[4] https://vgls.sdp.sirsidynix.net.au
This table compares the forestry industry size (scale and value) against the direct government budget commitment for the 2025–26 financial year.
🌲 State Forestry: Industry Size vs. Government Spend
| State | Plantation Area (ha) | Industry Workforce | Annual Production Value | Gov. Spend (% of Total Budget) |
|---|---|---|---|---|
| Victoria (VIC) | ~380,700 | ~25,000 | ~$5.2 Billion | 0.07% |
| New South Wales (NSW) | ~351,600 | ~22,000 | ~$4.8 Billion | 0.03% |
| Tasmania (TAS) | ~271,200 | ~5,500 | ~$1.2 Billion | 0.26% |
| Queensland (QLD) | ~205,000 | ~8,000 | ~$1.9 Billion | 0.02% |
| South Australia (SA) | ~163,500 | ~7,500 | ~$1.4 Billion | 0.04% |
🔍 Key Observations
- Efficiency vs. Support: Victoria manages the largest workforce and production value with a relatively lean budget share, having transitioned away from native forest oversight to a plantation-only model.
- Highest Commitment: Tasmania spends the most as a percentage of its budget. This reflects the high cost of managing active native timber harvesting and a smaller overall state budget.
- Intensive Production: South Australia shows high production value relative to its smaller plantation footprint, driven by the highly efficient “Green Triangle” softwood mills.
- Service Model: NSW and TAS maintain large State-Owned Corporations (Forestry Corp NSW and Sustainable Timber Tasmania). These entities generate their own revenue, meaning the “Government Spend” listed above is mostly for regulation, research, and community grants.
⚠️ Data Notes
- Workforce: Includes direct forestry, logging, and primary support services.
- Value: Represents the total economic output of the sector within that state.
- Budget: Based on 2025–26 State Budget Papers; excludes multi-year transition funds or disaster recovery.
The future of native timber harvesting in Australia has diverged into two distinct models: total transition (Victoria and Western Australia) and sustained production (New South Wales, Queensland, and Tasmania).
🏛️ The “Transition & Lock-Up” Model
States: Victoria, Western Australia
These jurisdictions have formally ended native timber harvesting on public land, citing climate change, biodiversity loss, and declining social license.
- Environmental Focus: Former “production forests” are being reclassified as National Parks or Conservation Reserves. The focus has shifted to carbon sequestration and tourism.
- Economic Shift: State support is now funnelled into the Plantation Investment Program. The goal is to replace native hardwood with plantation-grown fibre, though this transition takes 20–30 years to mature.
- Cultural Management: A significant move toward Joint Management with Traditional Owners, prioritising “cultural burning” over “commercial thinning.”
🏗️ The “Working Forest” Model
States: Tasmania, New South Wales, Queensland
These states view native forests as a renewable resource that, if managed correctly, can provide high-value specialty timber that plantations cannot replicate.
- Selective Harvesting: Moving away from clear-felling toward “selective harvesting,” where specific trees are taken while the canopy remains intact.
- Sovereign Capability: Advocates argue that native timber is essential for domestic housing and high-end manufacturing, reducing reliance on imported timber from nations with weaker environmental laws.
- Active Management: This model uses timber revenue to fund fire mitigation and pest control, arguing that “locked-up” forests become fire-prone and weed-infested without active human intervention.
🔄 Key Contrasts in Policy
| Feature | Victoria / WA Future | NSW / TAS / QLD Future |
|---|---|---|
| Primary Goal | Biodiversity & Carbon Storage | Sustainable Resource Yield |
| Land Status | Increasing National Park area | Permanent Timber Production Zone |
| Timber Source | 100% Plantation (Soft/Hardwood) | Mix of Native Hardwood & Plantation |
| Workforce | Shift to fire-fighting & tourism | Maintain logging & milling skills |
| Climate Strategy | Avoided emissions from logging | Wood products as long-term carbon storage |
⚖️ The Critical Pressure Points
Regardless of the model chosen, three factors will define the next decade for all states:
- Social License: High-profile litigation (e.g., the Leadbeater’s Possum case) continues to pressure “Working Forest” states.
- Fire Risk: As the climate warms, even “protected” forests face total loss. Governments must decide if “passive” or “active” management is the better defense.
- The “Gap”: There is currently a 20-year deficit in hardwood supply. Transition states (VIC/WA) may face extreme price spikes for floorboards and furniture as they wait for new plantations to grow.
The economic value of native timber industries has become increasingly polarized. In states like Victoria and WA, the value is now measured in transition packages and decommissioning costs, while in NSW, TAS, and QLD, it remains a functional, albeit niche, contributor to GSP (Gross State Product).
📈 Economic Value of Native Timber (2025–26 Estimates)
| State | Status | Estimated Annual Value | Economic Role |
|---|---|---|---|
| NSW | Active | ~$450M – $550M | High-value flooring, decking, and utility poles. |
| TAS | Active | ~$180M – $220M | Specialty “brand” timbers (Huon Pine) and structural hardwood. |
| QLD | Active | ~$110M – $140M | Native cypress for housing; poles for power networks. |
| VIC | Closed | $0 (Direct) | Transitioning to $800M+ in exit/redundancy payments. |
| WA | Closed | $0 (Direct) | Focused on jarrah/karri for “high-value” salvaged craft only. |
⚖️ Economic Pressure Points
- Import Substitution: As native supply drops in VIC/WA, Australia is spending roughly $2 billion extra per year on imported hardwood, often from regions with lower environmental oversight.
- Structural Gap: The economic “hole” left by native timber in Victoria has not yet been filled by plantations, leading to a supply squeeze for the furniture and flooring industries.
In recent years, economic studies have increasingly shifted from measuring timber “yield” to valuing forests through Ecosystem Accounting. This compares the direct revenue of logging against the broader “Industry Value Added” (IVA) of tourism, water, and carbon.
Direct Economic Comparison (Central Highlands, VIC)
The Australian National University (ANU) conducted a landmark study on the Central Highlands, which became a blueprint for Victoria’s 2024 native logging ban. It found that “standing” forests were exponentially more valuable than harvested ones. [1, 2]
| Activity [3, 4, 5] | Annual Industry Value Added (IVA) | Economic Multiplier |
|---|---|---|
| Tourism | $260 Million | ~21x higher than logging. |
| Water Provisioning | $310 Million | Older forests produce cleaner, higher-volume water. |
| Agriculture | $312 Million | Supported by forest-regulated microclimates/water. |
| Native Timber | $12 Million | Direct value of harvested logs before processing. |
🌳 The “Standing Forest” Value (Ecosystem Services)
The Australian Bureau of Statistics (ABS) released its first Ecosystem Accounts in 2025, placing a monetary value on the services forests provide without being cut down.
- Carbon Storage: Australian native forests are valued at $17.8 billion in carbon sequestration services alone.
- The “Great Forest” Proposal: Research into the proposed Great Forest National Park in Victoria suggests that transitioning to tourism would attract 400,000 extra visitors and add $71 million annually to the local regional economy through 750 new full-time jobs. [10]
⚖️ Summary of Values per Hectare
- Water Supply (VIC): Worth $2,023 per hectare per year.
- Native Timber (VIC): Worth $29 per hectare per year.
- Logging Loss (NSW): Costing taxpayers ~$3,058 per hectare to harvest. [6]
[1] https://science.anu.edu.au
[2] https://www.greatforestnationalpark.com.au
[3] https://www.greatforestnationalpark.com.au
[4] https://science.anu.edu.au
[5] https://fennerschool.anu.edu.au
[8] https://australiainstitute.org.au
Commercial plantation industries in Australia are the primary source of timber, providing roughly 90% of all logs harvested. While New South Wales has the largest softwood estate, Victoria maintains the largest total plantation footprint. [1, 2, 3, 4, 5]
🌲 State-by-State Comparison (2024–2026)
| State [6, 7, 8, 9, 10] | Total Area (ha) | Primary Type | Value of Log Production (2025 Est.) | National Context |
|---|---|---|---|---|
| Victoria (VIC) | ~380,700 | Balanced Mix | ~$616 Million | Largest total estate; leading hardwood producer (30% share). |
| New South Wales (NSW) | ~351,600 | Softwood | ~$468 Million | Dominant softwood producer (29% share of national softwood area). |
| Tasmania (TAS) | ~271,200 | Hardwood | ~$380 Million | Hardwood hub (28% share); focused on high-quality pulplog. |
| Queensland (QLD) | ~205,000 | Softwood | ~$200 Million | Specialises in tropical/subtropical pine for housing construction. |
| South Australia (SA) | ~163,500 | Softwood | ~$240 Million | High-efficiency “Green Triangle” region (softwood intensive). |
🏗️ Sector Specialisations
Victoria: The National Leader
According to Agriculture Victoria, the state produces roughly one-quarter of Australia’s plantation-grown wood. [8]
- Hardwood: Leads the nation in hardwood log production volume (30%), primarily Tasmanian Blue Gum and Shining Gum.
- Softwood: Managed largely through private institutional investment following the Gippsland Plantation expansion programs. [11, 12, 13, 14, 15]
New South Wales: The Softwood Powerhouse
NSW holds the largest commercial softwood estate in Australia (310,000 ha), managed largely by the Forestry Corporation of NSW. [16, 17]
- Housing Supply: Focuses on Radiata Pine, providing a critical supply for the domestic housing market.
- Challenges: Production volumes have seen slight declines due to 2019–20 bushfire impacts, though recovery replanting is near completion as of 2026. [18, 19, 20]
Queensland: The Tropical Specialist
Queensland’s plantation estate is almost exclusively softwood (southern and hoop pines). [21, 22, 23, 24]
- Construction Focus: Unlike the southern states, QLD pine is often specifically bred for termite resistance and high-strength applications in tropical climates.
- Regional Hubs: Concentrated in the South East and North Queensland higher rainfall coastal zones. [25, 26, 27, 28]
South Australia: The Green Triangle
While SA has a smaller land area, it is exceptionally productive due to the Green Triangle region (shared with VIC). [29, 30, 31]
- Efficiency: Features some of the most advanced softwood sawmills in the world.
- Institutional Ownership: Much of the estate is privately managed by global investment funds, providing a stable commercial model. [32]
Tasmania: The Hardwood Engine [33]
Tasmania possesses the largest area of hardwood plantations in Australia (190,000 ha). [34]
- Export Strength: The majority (87%) of logs harvested are pulplogs destined for high-value woodchip exports to Asian markets.
- Sawlog Transition: Increasing focus on managing hardwood plantations for longer cycles (25–50 years) to produce appearance-grade timber. [35]
📉 Industry Outlook (2026)
- Supply Gap: Australia remains a net importer of timber. Forestry Australia reports a $3.8 billion trade deficit, with domestic softwood supply expected to fall short by 2.6 million cubic metres by 2050.
- Value Trends: While harvest volumes have fluctuated, the gross value of production rose to $2.5 billion in FY2025 and is projected to reach $2.7 billion in FY2026 due to strong prices. [36, 37]
[1] https://www.agriculture.gov.au
[2] https://www.agriculture.gov.au
[3] https://www.agriculture.gov.au
[4] https://researchdata.edu.au
[5] https://www.agriculture.gov.au
[6] https://www.dpi.nsw.gov.au
[7] https://www.dpi.nsw.gov.au
[8] https://agriculture.vic.gov.au
[9] https://www.dpi.nsw.gov.au
[10] https://www.dpi.nsw.gov.au
[11] https://vfpa.com.au
[12] https://www.agriculture.gov.au
[13] https://www.agriculture.gov.au
[14] https://www.forestry.org.au
[16] https://www.parliament.nsw.gov.au
[19] https://australiainstitute.org.au
[20] https://www.dpi.nsw.gov.au
[21] https://www.agriculture.gov.au
[22] https://cabinet.qld.gov.au
[23] https://www.sciencedirect.com
[24] https://www.publications.qld.gov.au
[25] https://www.fao.org
[26] https://cabinet.qld.gov.au
[27] https://www.qldforestryhubs.com.au
[28] https://www.business.qld.gov.au
[29] https://www.sciencedirect.com
[30] https://www.tandfonline.com
[31] https://www.agriculture.gov.au
[32] https://www.fao.org
[34] https://www.agriculture.gov.au
[35] https://www.agriculture.gov.au
[36] https://www.forestry.org.au
[37] https://www.agriculture.gov.au
Ownership of Australian forestry assets has shifted significantly from the public to the private sector over the last 30 years. Today, most hardwood plantations are privately owned, while softwood plantations (critical for housing) remain under a mix of state-owned corporations and long-term private leases.
🏛️ Ownership Models by State
| State | Primary Model | Key Controlling Entities |
|---|---|---|
| Victoria (VIC) | Private / Institutional | Hancock Victorian Plantations (HVP) |
| NSW | State-Owned (GOC) | Forestry Corporation of NSW |
| Tasmania (TAS) | State-Owned (GOC) | Sustainable Timber Tasmania (STT) |
| Queensland (QLD) | Privatised (Lease) | HQPlantations |
| South Australia (SA) | Privatised (Lease) | OneFortyOne |
🌲 State-Specific Breakdowns
Victoria: The Private Leader
Victoria pioneered the privatisation of forestry in the late 1990s.
- Structure: Almost the entire plantation estate is privately owned. HVP Plantations manages approx. 240,000 hectares under a perpetual lease.
- Government Role: The state government acts primarily as a regulator through Agriculture Victoria and manages legacy native forest assets through DEECA.
New South Wales: State-Controlled
NSW maintains the largest state-owned forestry business in Australia.
- Structure: Forestry Corporation of NSW is a State-Owned Corporation (SOC). It manages both softwood plantations and native forests.
- Commercial Focus: It operates on a commercial basis, paying dividends back to the NSW Treasury.
Queensland: The 99-Year Lease
In 2010, Queensland sold the “harvesting rights” to its plantation business for $603 million.
- Structure: HQPlantations (owned by institutional investors) holds a 99-year lease on the plantation land.
- Land Ownership: The Queensland Government retains ownership of the land itself, but the trees and management rights are private.
South Australia: The Institutional Model
Similar to QLD, SA sold the forward-harvesting rights of its “Green Triangle” forests in 2012.
- Structure: OneFortyOne (owned by international funds) manages the softwood estate.
- Local Processing: A key condition of the sale was maintaining local milling capacity in Mount Gambier.
Tasmania: Integrated Public Management
Tasmania retains a traditional public model due to the high integration of native and plantation assets.
- Structure: Sustainable Timber Tasmania is a Government Business Enterprise (GBE).
- Recent Shifts: There is ongoing debate in Tasmania regarding the potential sale of its hardwood plantation assets while retaining native forest control.
💰 Who Are the Private Owners?
The private portion of the industry is dominated by Timber Investment Management Organisations (TIMOs) and superannuation funds.
- Global Funds: Companies like Global Forest Partners and New Forests manage billions in assets on behalf of pension funds.
- The “Green Triangle”: This region (straddling the VIC/SA border) is almost entirely managed by OneFortyOne and HVP, making it the hub of private forestry in Australia.
📊 Ownership Share (National Average)
- Public (State): ~21% (Primarily in NSW and TAS)
- Private Institutional: ~53% (Dominant in VIC, QLD, and SA)
- Private (Small Growers/Farmers): ~26%
Financial returns from state-owned forestry corporations are typically paid as dividends, which are often based on a percentage of Net Profit After Tax (NPAT). However, because these entities often manage loss-making native timber divisions or are undergoing major restructures, the actual “cash back” to treasuries varies wildly.
2024–25 Dividend Returns to State Treasuries [1]
| State-Owned Corporation | Dividend Payout (Est. FY25) | Payout Policy | Notes |
|---|---|---|---|
| Forestry Corporation of NSW | $0.8 million | 70% of NPAT | Significant losses in native forestry (~$32M) offset softwood profits. |
| Sustainable Timber Tasmania | $0 (Direct Dividend) | Discretionary | Profits are typically reinvested or used to fund public land management (e.g., firefighting). |
| VicForests (VIC) | $0 | N/A | Abolished 30 June 2024; required a $149M bailout before closure. |
| HQPlantations (QLD) | Lease Revenue | Private Lease | Paid $603M upfront (2010); annual revenue is now from land rent, not dividends. |
| OneFortyOne (SA) | Lease Revenue | Private Lease | Paid $670M upfront (2012); state receives land taxes and community service fees. |
🏛️ Entity Performance Summaries
New South Wales: The Profit-Loss Split
- The Dividend: Forestry Corporation of NSW has budgeted a dividend of just $0.8 million for 2024–25, a steep decline from previous years.
- The Drain: While the Softwood Division is generally profitable, the Native Forest Division recorded a $32 million loss in 2024–25, effectively “cancelling out” the potential returns to the NSW Treasury.
Tasmania: The “Eight-Year Profit” Run
- Performance: Sustainable Timber Tasmania reported its eighth consecutive year of profit in 2024–25.
- Financial Role: Instead of high dividends, the state uses STT to fund “Community Service Obligations” (CSOs). The government provides roughly $8 million annually to STT to maintain 800,000+ hectares of forest for public use, tourism, and firefighting.
Victoria: From Dividend to Liability
- Final Status: VicForests was formally abolished in 2024. In its final years, it ceased being a revenue source and became a significant financial liability.
- Legacy Cost: The Victorian Government has committed over $800 million to the Forestry Transition Program to settle contracts, retrain workers, and manage former production land now under DEECA control. [2]
Queensland & South Australia: The Upfront Windfall
- Structure: Because these states sold long-term (99-year) leases, they no longer receive annual dividends based on timber sales.
- Revenue Today: Instead of dividends, these states receive annual land rentals and Tax Equivalent Payments (TEPs). For example, HQPlantations pays rates and taxes on its defined forest area of ~309,000 hectares.
🔍 Analysis: Is it a good investment?
For the public, the “dividend” is often less about cash and more about service. In NSW and TAS, the state-owned entities provide firefighting equipment, road maintenance, and public recreation sites that would otherwise have to be funded directly from the state’s general budget.
[1] https://www.treasury.tas.gov.au
The Australian forestry sector faces significant environmental challenges as it transitions between native harvesting and plantation models. These gaps often stem from the conflict between commercial yield and ecosystem health.
⚠️ Primary Environmental Gaps
1. The “Green Desert” Effect
Plantations, particularly monocultures of Radiata Pine or Blue Gum, lack the structural complexity of native forests.
- Challenge: These forests often lack hollow-bearing trees, fallen logs, and diverse understory, leading to significantly lower bird and mammal biodiversity.
- Gap: There is a lack of mandatory “biodiversity corridors” within private plantation estates in some jurisdictions.
2. Water Yield & Catchment Health
Fast-growing plantations consume vast amounts of groundwater.
- Challenge: In regions like the Green Triangle (VIC/SA), plantations can “shade” aquifers, reducing water availability for agriculture and wetlands.
- Gap: Policy lag in accounting for the “water interception” cost of large-scale carbon-offset plantings.
3. Invasive Species & Biosecurity
- Challenge: Commercial species (like Pine) often escape plantation boundaries to become “wilding pines,” choking out native bushland.
- Gap: Insufficient funding for long-term “edge management” once a plantation is harvested or abandoned.
🏛️ Regulatory & Policy Challenges
| Challenge | Impact | Key States Affected |
|---|---|---|
| Climate Resilience | Rising temperatures and drought increase tree mortality and reduce growth rates. | All (esp. WA & QLD) |
| Bushfire Risk | Large contiguous blocks of even-aged trees act as fuel ladders, increasing fire intensity. | NSW, VIC, SA |
| Social License | Public opposition to clear-felling, even in plantations, complicates long-term planning. | TAS, NSW |
| Old-Growth Loss | Despite bans, accidental or “illegal” clearing of high-value habitat remains a risk. | NSW, TAS |
🔄 The “Transition Gap” in Victoria
Following the 2024 native timber ban, Victoria faces a unique environmental challenge: Active Management.
- The Problem: Native forests previously managed by the timber industry for fire breaks and weed control are now “unmanaged.”
- The Risk: Without the industry’s heavy machinery and road maintenance, these forests may become more susceptible to catastrophic bushfires and invasive pests like deer and blackberries.
🛠️ Emerging Solutions
- Precision Forestry: Using LiDAR and drones to manage forests at a “tree-by-tree” level to reduce soil compaction and chemical runoff.
- Mechanical Thinning: NSW and TAS are exploring thinning native forests to promote “old-growth” characteristics faster while extracting some timber.
- Integrated Farm Forestry: Moving away from “industrial blocks” toward smaller patches of trees integrated into sheep and cattle farms to provide shade and biodiversity.
🛡️ Key Goal: The industry is currently moving toward Forest Stewardship Council (FSC) or PEFC certification to prove to global markets that their timber is not contributing to deforestation.
The Australian forestry sector faces a deepening “structural gap” as native timber harvesting ceases in major states, leaving the economy heavily reliant on a plantation sector that is not yet large enough to meet domestic demand. [1, 2, 3, 4]
📉 Primary Economic Gaps
1. The Domestic Supply Deficit
Australia is a net importer of timber, and this gap is widening. [5, 6, 7]
- Trade Deficit: The nation currently faces a $2 billion to $3.8 billion trade deficit in wood products.
- Housing Shortage: ABARES projects that by 2050, the demand for softwood sawlogs for housing will exceed domestic supply by 3.4 million cubic metres per year.
- The “Hardwood Hole”: With native harvesting banned in Victoria and WA, high-value hardwood for flooring and furniture must now be imported, often at 30–50% higher costs. [8, 9]
2. Sovereign Risk & Investment Barriers
Investors are cautious about long-term plantation commitments due to shifting state policies. [10, 11]
- Policy Volatility: Rapid changes in native forest laws (like the 2024 Victorian ban) create “sovereign risk” where investors fear that long-term plantation assets could also face future regulatory restrictions.
- Land Value Competition: The cost of agricultural land in prime forestry regions (like Gippsland or the Green Triangle) has skyrocketed, making it more profitable for landholders to graze cattle than plant trees with a 30-year ROI. [12, 13, 14, 15, 16]
🏗️ Core Economic Challenges
| Challenge [17, 18, 19, 20, 21] | Economic Impact | Current Status |
|---|---|---|
| Labour Shortages | High vacancy rates in regional sawmills; lack of skilled harvester operators. | Severe: Half of all forestry businesses report difficulty recruiting. |
| Input Costs | Skyrocketing diesel, electricity, and haulage costs are eroding mill margins. | Ongoing: Many smaller mills are closing as they cannot pass on costs. |
| Asset Loss | Millions of dollars in “standing value” lost to catastrophic bushfires. | Critical: 2019–20 fires destroyed roughly 10% of the NSW softwood estate. |
| Regulatory Burden | New National Environment Standards (expected mid-2026) may increase compliance costs. | Emerging: Uncertainty is stalling new contract negotiations in Tasmania. |
🔄 The “Value-Add” Gap
Australia exports a large volume of raw logs and woodchips while importing high-value engineered wood products (like CLT or LVL). [22, 23, 24]
- Manufacturing Decline: Since 2006, forestry employment has declined as the domestic processing sector shrinks.
- The Opportunity Cost: Exporting raw fibre creates far fewer jobs than processing it locally. Regional “Forestry Hubs” are being trialled to keep processing jobs in Australia, but they require significant infrastructure investment. [25, 26, 27]
💡 Summary: The greatest challenge for 2026 is the time lag. Even with massive government investment today, it will take decades for new plantations to bridge the supply gap left by the native timber exit. [28]
[2] https://blog.tradesales.com.au
[3] https://masterbuilders.com.au
[7] https://www.resourcewise.com
[8] https://www.agriculture.gov.au
[9] https://assets.nationbuilder.com
[10] https://www.sciencedirect.com
[11] https://www.fao.org
[15] https://www.baeconomics.com.au
[17] https://www.sciencedirect.com
[18] https://www.beefcentral.com
[20] https://fwpa.com.au
[23] https://www.resourcewise.com
[24] https://fwpa.com.au
[25] https://fwpa.com.au
[26] https://www.mdpi.com


Leave a Reply