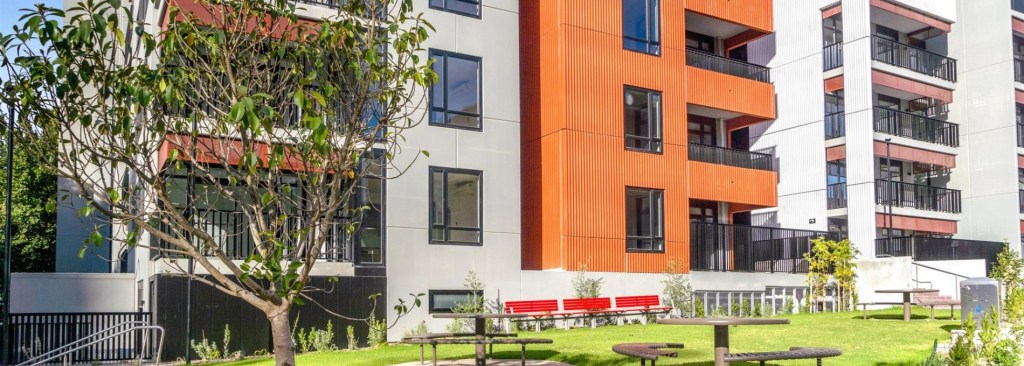
Question: What does $911,200,000 in combined State and Federal funding (including some loan facility) get you?
Answer: Net increase of 174 dwellings or an increase of 39%.
And 0% of these are Public Housing, instead, 100% are managed by Community Housing Providers. Only 45.2% of completed dwellings are social housing.
54.8% of the new structures to market-rate Build-to-Rent (34.4%) and capped affordable “essential worker” housing (20.4%) to cross-subsidise the public housing.
The total combined government capital and debt allocation across the complete Ground Lease Model 1 (GLM1) portfolio equates to $665,109 per individual dwelling built.
If you went to the pub and told people this is what’s happening, they wouldn’t believe you. But they would believe you that the construction mega-consortium members are making out like bandits.
That this policy framework has been allowed to go largely unchallenged is almost unbelievable. The problems are self-evident:
- Privatisation by Stealth and Loss of Tenant Rights
- High Upfront Costs vs. Refurbishment Options
- Lack of Accountability and “Confidential” Business Cases
- Poor Social Outcomes and Mixed-Tenure Friction
- Flawed Definitions of “Affordable” Housing
And that is just the start.
Clear Risks and Hidden Costs of the Ground Lease Model
When you strip away the complicated financial terms, this housing model relies on a risky 40-year gamble between the government, private builders, and charities. Over such a long time, several serious practical and financial problems can occur:
- The Risk of Government Bailouts: If costs rise too high over the next 40 years, the private companies might run out of money. Because vulnerable people live in these apartments, the government cannot just let the buildings go bust. Taxpayers will likely be forced to step in with expensive bailouts to keep the lights on.
- Overpaying for Construction Upfront: Private developers and big construction companies charge a massive premium to build these complexes. This means the government pays much more per apartment right from the start compared to if they hired a builder directly.
- Unpredictable Yearly Costs for Taxpayers: The government promises to pay the private companies a guaranteed yearly fee for 40 years. Because these payments go up with inflation, a sudden jump in living costs can blow a massive hole in the state budget.
- The “Cry Poor” Breakdown at Year 20: As the buildings get older and closer to the 40-year mark, the private companies have less incentive to look after them. At year 20 or 30, they might claim they are broke, let the buildings run down, and leave the government to pay for emergency repairs despite their “ironclad” promises.
- A Growing Army of Contract Managers: Keeping track of whether the private companies are actually doing their jobs requires an enormous amount of paperwork. Ironically, the government has to hire a whole new army of public servants just to police the contracts, defeating the purpose of outsourcing.
- Charities Going Under: The charities chosen to manage the tenancies (Community Housing Providers) often operate on razor-thin financial margins. If one of these charities collapses, the government has to step in to run the properties anyway.
- Selling Off Properties for Cash: If a housing charity gets into financial trouble or decides to change its strategy, it can simply sell the buildings and invest the money in other projects or move out of the state entirely, leaving local renters stranded.
- Drop in Quality and Support for Tenants: Because these housing charities operate like businesses to cut costs, tenants often suffer. Residents frequently complain about long delays for basic repairs, understaffed offices, and a lack of real support compared to traditional public housing.
- Relying on a Fickle Private Rental Market: The whole model assumes that wealthy renters will pay premium prices for the private apartments in the building to help pay for the social housing units. If the property market crashes or vacancy rates change, that private money dries up, leaving the social housing underfunded.
- Unfair Rules for “Essential Workers”: The discounted “affordable” apartments are handed out based on an arbitrary list of jobs (like nursing or teaching) rather than how much money a person actually makes. This creates an unfair system that locks out highly vulnerable people who happen to work in other industries.
- “Gaming” the Welfare System: Moving tenants from public housing to housing charities looks like a sneaky trick to exploit the federal welfare system. It allows the state government to force tenants onto Federal Centerlink rent assistance, essentially shifting Victoria’s housing bills onto federal taxpayers without actually fixing the root problem.
The policy solution is simple. Build and maintain real Public Housing for the most vulnerable. End the financial house of cards.
Google backgrounder
Ground Lease Model 1 (GLM1) is the foundational pilot of Victoria’s Public-Private Partnership (PPP) housing strategy [1, 2] . Funded by a $394.1 million investment from Housing Australia, it successfully bypassed traditional public housing funding constraints.
The model strips out the outright sale of public land, opting instead to lease Crown land to the Building Communities consortium (comprising Tetris Capital, ICON Construction, and Community Housing Victoria Limited) for a strict 40-year duration. In early 2024, the primary package reached completion, welcoming residents into modern, tenure-blind, 7-star energy-rated communities. [3, 4, 5, 6, 7]
The distribution of the 1,110 total dwellings across GLM1 is allocated precisely by housing tier: [8]
- Social Housing: 619 homes managed by Community Housing Limited (CHL) for individuals on the Victorian Housing Register.
- Market Rental (BTR): 365 homes managed by Horizon Housing Realty (HHR) and rented to the general public to subsidize the estate.
- Affordable Housing: 126 homes capped at 75% of local market rents for low-income workers.
- Specialist Disability Accommodation (SDA): 52 dedicated dwellings woven seamlessly into the complexes. [8, 9]
Expanded Location Breakdown
[GLM1 Core Sites] ├── Bangs Street (Prahran) ─── 434 Homes (Completed 2024) ├── New Street (Brighton) ──── 299 Homes (Completed 2024) ├── Victoria St (Flemington) ── 351 Homes (Completed 2024) └── Holland Court (Flemington) ─ 286 Homes (Delivering Late 2026)
1. Bangs Street, Prahran (Completed Early 2024) [10, 11]
- The Scale: This represents the largest single footprint of the initial three completions, delivering 434 homes (comprising 228 social housing units, 195 market build-to-rent units, and 11 specialist disability units). [4, 12]
- The Design: Designed by architecture firm Jackson Clements Burrows (JCB), the development earned architectural acclaim for replacing deteriorating mid-century walk-ups with a porous, precinct-style layout. It connects directly to the adjacent Chris Gahan Reserve and features public thoroughfares, internal communal courtyards, and social enterprise spaces. [3, 8, 12, 13, 14]
2. New Street, Brighton (Completed Early 2024)
- The Scale: Delivered 299 new homes within Melbourne’s high-wealth bayside corridor.
- The Impact: This site was highly scrutinized because it introduced high-density social and affordable housing into a traditionally exclusive, low-density suburb. The layout successfully blended public housing tenants alongside private market-rate renters in identical, premium-finish structures to eliminate geographic wealth segregation. [3, 9, 13, 15]
3. Victoria Street, Flemington (Completed Early 2024)
- The Scale: Delivered 351 homes as the initial component of the sprawling Flemington estate master plan.
- The Community Integration: It features state-of-the-art community asset rooms, open green parklands, local neighborhood barbecue facilities, and an on-site office for Community Housing Limited (CHL) to ensure localized, 24/7 tenancy management. [3, 9, 10, 16, 17]
4. Holland Court, Flemington (Under Construction / Final Delivery) [10, 18]
- The Scale: Rather than a separate contract, this site represents a major 286-home expansion package appended directly onto the baseline GLM1 deed. [19, 20, 21]
- The Status: While the first three sites are fully occupied, Holland Court is actively being constructed by ICON. It is on track to finalize construction and begin moving tenants in from late 2026. [10, 16, 19]
[1] https://www.northprojects.com.au
[2] https://www.housingaustralia.gov.au
[4] https://www.housingaustralia.gov.au
[5] https://wtpartnership.com.au
[6] https://infrastructurepipeline.org
[10] https://www.homes.vic.gov.au
[11] https://www.theurbandeveloper.com
[12] https://www.instagram.com
[13] https://citta.com.au
[14] https://www.homes.vic.gov.au
[15] https://www.pacificlink.org.au
[16] https://www.homes.vic.gov.au
[17] https://engage.vic.gov.au
[18] https://ministers.treasury.gov.au
[19] https://infrastructurepipeline.org
[20] https://infrastructurepipeline.org
[21] https://ministers.treasury.gov.au
[22] https://engage.vic.gov.au
The individual site allocations within the Ground Lease Model 1 (GLM1) package reveal a distinctly tailored tenant mix. Homes Victoria alters the ratio of social, market, and affordable housing at each location based on local density mandates and neighbourhood infrastructure capacity. [1, 2, 3]
Note: Across these properties, Specialist Disability Accommodation (SDA) is structurally embedded directly into either the social or affordable allocations. [2, 3]
The Macro Distribution Matrix
Across the four active project footprints, the exact dwelling volumes are divided as follows:
| Development Site [4, 5, 6, 7, 8, 9, 10, 11, 12] | Total Homes | Social Housing | Market Rental (BTR) | Affordable Housing | Specialist Disability (SDA) |
|---|---|---|---|---|---|
| Bangs Street, Prahran | 434 | 228 | 195 | Included in Market/Social | 11 |
| New Street, Brighton | 299 | 151 | 148 | Included in Market/Social | Woven throughout |
| Victoria Street, Flemington | 359 | 240 | 0 | 119 | Woven throughout |
| Holland Court, Flemington | 286 | 50 | 0 | 236 | Woven throughout |
In-Depth Breakdown by Site
1. Bangs Street, Prahran (Completed) [5, 13]
- The Split: 52.5% Social Housing | 44.9% Market BTR | 2.6% SDA.
- The Breakdown: The project delivered 434 apartments. It is managed by Community Housing Limited (CHL) and relies on a near-even mix. It utilizes high-end inner-city private market rental rates to directly offset the operational costs of its 228 social housing homes. [2, 4, 5, 13, 14]
2. New Street, Brighton (Completed) [13, 15]
- The Split: 50.5% Social Housing | 49.5% Market BTR.
- The Breakdown: Spanning 299 total homes, this site holds the most balanced “51:49” socio-economic target in the package. Divided cleanly into 151 social housing units and 148 private market rental homes, it was purposefully arranged to inject immediate public housing options into an affluent bayside enclave without clear architectural separation. [2, 7, 16, 17]
3. Victoria Street, Flemington (Completed)
- The Split: 66.8% Social Housing | 33.2% Affordable Housing | 0% Market BTR.
- The Breakdown: Victoria Street completely excludes standard, top-tier private market rentals. Instead, its 359 total units focus purely on lower-income tiers. It pairs 240 social housing slots for vulnerable applicants with 119 designated affordable rental homes aimed at essential worker households. [9, 18]
4. Holland Court, Flemington (In Delivery) [13]
- The Split: 17.5% Social Housing | 82.5% Affordable Housing | 0% Market BTR.
- The Breakdown: Acting as the final 286-home phase of the GLM1 contract loop, Holland Court operates as a heavy affordable housing anchor. It provides only 50 standard social housing apartments, choosing to dedicate its massive remaining 236-unit footprint purely to capped affordable housing. [10, 11]
[1] https://www.homes.vic.gov.au
[4] https://www.homes.vic.gov.au
[7] https://www.parliament.vic.gov.au
[8] https://www.shelterwa.org.au
[9] https://www.homes.vic.gov.au
[10] https://www.homes.vic.gov.au
[11] https://engage.vic.gov.au
[12] https://www.homes.vic.gov.au
[13] https://www.homes.vic.gov.au
[14] https://chl.org.au
[15] https://engage.vic.gov.au
[16] https://www.premier.vic.gov.au
[17] https://jamesnewbury.com.au
[18] https://chl.org.au
[20] https://engage.vic.gov.au
Under the Homes Victoria Ground Lease Model (GLM), the definition of social housing shifts away from traditional government management. [1]
To understand the split, it helps to look at the definitions used by Homes Victoria:
- Public Housing: Owned and managed directly by the state government (the Director of Housing).
- Community Housing: Secure, long-term housing managed instead by highly regulated, not-for-profit community housing providers.
- Social Housing: The official umbrella term encompassing both public and community housing. [2, 3, 4]
The GLM1 Split: 100% Community Housing [5]
For Ground Lease Model 1 (GLM1), there is zero public housing. Every single one of the 619 designated “social housing” homes across the package is categorized as Community Housing. [1, 5, 6, 7]
Rather than the state acting as the landlord, Homes Victoria appointed Community Housing Limited (CHL) to take over 100% of the tenancy and property management operations for the 40-year duration of the lease. [5, 6]
The complete breakdown of the 1,110-home GLM1 portfolio explicitly separating these tiers looks like this:
| Development Site [5, 8, 9, 10, 11] | Public Housing | Community Housing (Social Tier) | Market Rental (BTR) | Affordable Housing |
|---|---|---|---|---|
| Bangs Street, Prahran | 0 | 228 homes | 195 homes | Woven inside market/social |
| New Street, Brighton | 0 | 151 homes | 148 homes | Woven inside market/social |
| Victoria Street, Flemington | 0 | 240 homes | 0 | 119 homes |
| Holland Court, Flemington | 0 | 50 homes | 0 | 236 homes |
| TOTALS | 0 (0%) | 619 (55.8%) | 343 (30.9%) | 148 (13.3%) |
Why Did the State Switch to Community Housing?
The total pivot from public to community housing within the GLM framework is central to the project’s financial design: [1]
- Unlocking Commonwealth Rental Assistance (CRA): Public housing tenants are legally ineligible to receive the federal government’s CRA. However, community housing tenants can claim CRA. By shifting management to CHL, the project unlocks a massive stream of federal funding that tenants pass on as rent. This extra cash flow helps the consortium repay the multi-million dollar construction loans without the state needing to fund the entire build upfront. [3, 5]
- The “Tenant-Blind” Reality: While critics from organizations like the Victorian Public Tenants Association frequently voice concern over the systemic reduction of pure public housing stock, the front-end experience for applicants remains tightly aligned. CHL is legally required to draw tenants directly from the same unified Victorian Housing Register waitlist used for public housing. [2, 4]
- Rent Protections: Rents within the 619 community housing slots are still capped tightly to safeguard low-income tenants—calculating out to a maximum of 25% to 30% of a household’s total income, mirroring traditional public housing calculations. [2, 12]
[3] https://www.parliament.vic.gov.au
[5] https://www.housingaustralia.gov.au
[8] https://www.homes.vic.gov.au
[10] https://www.instagram.com
[11] https://architectureau.com
Within the Homes Victoria Ground Lease Model 1 (GLM1) portfolio, the configuration of the 1,110 total dwellings is distinctly structured by bedroom capacity to meet the diverse needs of multi-person families, single residents, and specialist disability profiles. [1, 2]
Every development incorporates a mix of studio, 1, 2, 3, and 4-bedroom layouts. The absolute housing capacities and tenant splits across the completed and active construction footprints are organized below: [1, 2]
Individual Development Capacity Matrix
| Site & Location [2, 3, 4, 5, 6, 7] | Total Homes | Studio & 1-Bed Capacity | 2-Bedroom Capacity | 3-Bedroom Capacity | 4-Bedroom Capacity |
|---|---|---|---|---|---|
| Bangs Street, Prahran | 434 | 231 homes | 156 homes | 47 homes | 0 homes |
| New Street, Brighton | 291 | 110 homes | 132 homes | 49 homes | 0 homes |
| Victoria Street, Flemington | 359 | 145 homes | 120 homes | 84 homes | 10 homes |
| Holland Court, Flemington | 286 | 122 homes | 114 homes | 50 homes | 0 homes |
| PORTFOLIO TOTALS | 1,370 | 608 homes | 522 homes | 230 homes | 10 homes |
In-Depth Breakdown by Site & Capacity
[GLM1 Portfolio Bedroom Distribution] ├── Studios & 1-Bedrooms ─── 44.4% (608 Homes) ├── 2-Bedrooms ────────────── 38.1% (522 Homes) ├── 3-Bedrooms ────────────── 16.8% (230 Homes) └── 4-Bedrooms ────────────── 0.7% (10 Homes)
1. Bangs Street, Prahran (Completed) [8]
- Total Configuration: 434 homes across seven buildings.
- Capacity Distribution: Features 231 studio and 1-bedroom configurations, 156 two-bedroom units, and 47 three-bedroom units.
- SDA Housing Integration: Woven natively into this blueprint are 11 dedicated Specialist Disability Accommodation (SDA) units. The physical sizes of the properties on-site scale dynamically from compact 37m² studio micro-apartments up to spacious 122m² inner-city townhouses. [1, 3, 9]
2. New Street, Brighton (Completed)
- Total Configuration: 291 homes.
- Capacity Distribution: Configured with 110 one-bedroom apartments, 132 two-bedroom apartments, and 49 large three-bedroom properties.
- SDA Housing Integration: Includes 8 strategically distributed SDA properties. To remain tenure-blind, the floor plans span a uniform 58m² for single-bedroom homes up to 100m² for triple-bedroom homes, with many variants incorporating individual courtyard access or parking bays. [6]
3. Victoria Street, Flemington (Completed)
- Total Configuration: 359 homes. [6]
- Capacity Distribution: Constructed with 145 single-bedroom properties, 120 two-bedroom layouts, 84 three-bedroom units, and 10 large four-bedroom units. [2]
- SDA Housing Integration: Anchors 7 specialized SDA properties. This particular development purposefully carries the highest proportion of larger multi-bedroom properties in the package (including the portfolio’s only 4-bedroom variants) to accommodate larger families on the Victorian Housing Register. [2, 6, 10]
4. Holland Court, Flemington (In Delivery)
- Total Configuration: 286 homes. [7]
- Capacity Distribution: Moving toward final delivery stages with a confirmed internal plan of 122 single-bedroom, 114 double-bedroom, and 50 triple-bedroom homes. [7]
- Target Demographics: It completely excludes studios and 4-bedroom homes, balancing its structure to support smaller families and couples within its designated affordable housing tier. [7]
[2] https://www.homes.vic.gov.au
[4] https://greenstreetnews.com
[5] https://www.homes.vic.gov.au
[7] https://www.homes.vic.gov.au
[10] https://engage.vic.gov.au
[11] https://www.instagram.com
The unique design of the Ground Lease Model 1 (GLM1) Public-Private Partnership (PPP) means that the state government does not directly fund the construction of individual housing types (such as community vs. market rent blocks). [1, 2, 3]
Instead, the Victorian Government made a single consolidated funding contribution of $517 million directly to the project consortium (Building Communities). [4]
The consortium then combined this public money with its own private financing—secured via a massive $517 million sustainability bond package from Housing Australia—to pay for the design, construction, and 40-year maintenance of the entire multi-site blueprint. [1, 5]
How the Financial Model Works
The government explicitly structured the funding model so that higher-yielding housing types cross-subsidize the construction and operation of vulnerable housing types, requiring far less direct taxpayer capital up front: [1, 2]
[GLM1 Financial Ecosystem] ├── Market BTR (Private Rent) ─── FULL MARKET REVENUE ──┐ │ ├── CROSS-SUBSIDIZES ├── Affordable Housing ────────── 75% OF MARKET RENT ─────┤ │ ▼ └── Community Housing ─────────── 25-30% TENANT INCOME + FEDERAL CRA SUPPORT
1. Market Rental (BTR) & Affordable Housing Tiers [6]
- Direct Government Spend: $0
- The Mechanism: To protect the public purse, the state government contributed zero direct funds to build or fit out the private market rental apartments or the capped affordable housing dwellings. Instead, the consortium funds these builds through commercial debt. The premium market rents collected from tenants on-site over the 40-year lease are used to pay down the construction loans and directly cross-subsidize the lower-income apartments in the exact same buildings. [1, 2]
2. Community (Social) Housing Tier [7]
- Direct Government Spend: The bulk of the $517 million state budget is directed here, supplemented by an explicit $50 million targeted capital grant pulled from the Big Housing Build repository to seed the massive Flemington estate expansions. [1, 4]
- The Mechanism: Because community housing tenants have their rents strictly capped at 25% to 30% of their income, these units cannot independently cover their build and debt costs. The $517 million state contribution acts as a capital cushion. It ensures that Community Housing Limited (CHL) can operate 619 long-term social housing placements without running at a loss. [1, 2, 4, 8, 9]
3. Public Housing Tier [7]
- Direct Government Spend: $0
- The Mechanism: Because the state completely pivoted to community housing providers to manage the tenancies, no public housing was constructed, resulting in zero direct public landlord operational spend. [1, 2, 10]
Auxiliary Direct Spend (State Balance Sheet) [7]
Beyond the baseline $517 million infrastructure contract, the State of Victoria absorbs several separate, direct project expenses to facilitate GLM1: [4]
- Relocation and Tenant Care Services: Homes Victoria funds internal departmental teams tasked with handles the complex physical transition of moving hundreds of legacy public housing households off the old land footprints and into temporary or permanent alternative homes. [11]
- Land Value Holding Costs: Because the state legally retains 100% ownership of the Crown land under a 40-year lease rather than selling it to the developer, the state absorbs the ongoing asset holding and statutory valuation costs over the multi-decade agreement. [2, 7, 12]
[1] https://www.tetriscapital.com
[2] https://www.parliament.vic.gov.au
[4] https://infrastructurepipeline.org
[5] https://www.housingaustralia.gov.au
[6] https://research.unimelb.edu.au
[7] https://www.tetriscapital.com
[8] https://www.parliament.vic.gov.au
[9] https://www.architectureanddesign.com.au
[10] https://honisoit.com
[11] https://www.parliament.vic.gov.au
[12] https://greenstreetnews.com
[13] https://www.tetriscapital.com
The return on investment (ROI) for the Victorian Government’s $517 million foundational funding into Ground Lease Model 1 (GLM1) is structured as a long-term asset play and systemic cost-offset mechanism, rather than a traditional cash-dividend yield. [1]
Because the state acts as the master lessor under a Public-Private Partnership (PPP), its returns are realized across three distinct areas: [2]
1. Capital Asset Multiplier (The “Free” Upgrades)
The primary structural return is that the government receives a massive real estate upgrade at a steep discount to the true cost of development:
- The Asset Handback: Unlike previous estate renewals that permanently sold off public land parcels to private buyers, Homes Victoria retains 100% ownership of the Crown land. At the exact end of the 40-year lease term, all 1,370 newly built residential apartments—including the premium market-rate Build-to-Rent properties—revert entirely to direct state government ownership for free. [2, 3, 4]
- Guaranteed Handback Condition: The contract legally obligates the Building Communities consortium to fully maintain, repair, and structurally upgrade the buildings out of their own pockets. The state is guaranteed to take full title of the properties in the exact same pristine, high-performing operational condition they were in at completion. [5, 6]
2. Strategic Risk Shielding (Zero Maintenance Liability)
Traditional public housing functions as a major ongoing cash drain for the state balance sheet due to compounding maintenance deficits. The GLM1 architecture shifts this burden entirely:
- Lifecycle Cost Transfer: Over the 40-year lease duration, the government’s direct operational spend is $0. The private consortium absorbs 100% of the financial risk regarding plumbing failures, concrete cancer, appliance replacements, and general estate wear-and-tear. [6]
- The Capital Injection Leverage: By putting forward $517 million, the government successfully leveraged $517 million in matching private commercial finance (via Housing Australia’s sustainability bonds). Effectively, taxpayers paid for roughly half the asset value but take title to 100% of the multi-billion-dollar portfolio at expiry. [1, 3, 4]
3. Structural Operational Savings (Federal Subsidization)
By pivoting the management of the 619 social housing slots away from the state public housing department and over to Community Housing Limited (CHL), the state opens up a massive federal funding loop: [7]
- Capturing Federal CRA Cash: Community housing residents can legally claim the Federal Government’s Commonwealth Rental Assistance (CRA). Traditional public housing tenants cannot. [8]
- The Return to State Coffers: Millions of dollars in ongoing federal welfare funding are seamlessly funnelled back into Victoria’s local housing ecosystem via tenant rents. This external cash flow sustains the upkeep of the buildings, entirely removing the operational funding burden from the state budget.
Summary Balance Sheet View
| What the Government Gave [1, 3, 4, 6] | What the Government Receives (The Return) |
|---|---|
| $517M Capital Contribution | 1,370 Modern, 7-Star Energy Rated Homes |
| Temporary 40-Year Land Use Rights | 100% Reversionary Ownership of All Buildings at Expiry |
| Administrative Relocation Support | 40 Years of Zero Structural Maintenance Costs |
[1] https://infrastructurepipeline.org
[2] https://infrastructure.org.au
[3] https://www.housingaustralia.gov.au
[5] https://www.shelterwa.org.au
[6] https://www.homes.vic.gov.au
[8] https://www.geelongcity.vic.gov.au
The private and institutional entities within the Building Communities consortium (primarily Tetris Capital, ICON Construction, Citta Property Group, and their equity partners) generate returns through a strictly regulated Availability-Payment Public-Private Partnership (PPP) model, alongside direct commercial real estate revenue streams [1, 2, 3, 4] .
Because the consortium is legally forbidden from selling the underlying public land or any of the built apartments, they generate their return on equity (ROE) across three primary operational mechanisms over the 40-year lease agreement. [1, 5]
1. State-Backed “Availability Payments” (The Core Low-Risk Yield)
The most substantial, low-risk revenue generator for the institutional investors is a steady stream of Availability Payments paid directly from the Victorian Government balance sheet. [1]
- The Mechanism: Rather than relying entirely on vulnerable tenants to pay market rent, the state government pays the consortium a fixed, ongoing contract fee to ensure the community and social housing units are “available” and up to strict 7-star energy standards. [1, 6]
- The Return Profile: These payments are indexed to inflation, guaranteeing financial stability. Because the payments are backed by the government, the consortium’s equity partners receive a predictable, annuity-style return that safely services their ultra-low-interest $517 million Housing Australia sustainability bonds. [1, 7, 8, 9, 10]
2. Market Rent Extraction (The Premium BTR Upside)
While the social housing relies on state backing, the consortium holds a direct commercial upside via the 343 Build-to-Rent (BTR) market-rate apartments woven into the sites (such as Bangs Street and New Street). [11]
- The Mechanism: The consortium captures 100% of the rent paid by private, standard market-rate tenants who lease these apartments.
- The Return Profile: Since these specific units command standard Melbourne market premiums, they generate strong cash yields. The private players use a portion of this market revenue to cross-subsidize the social blocks, with the remainder kept as a commercial return on their initial development capital. [5]
3. Vertical Integration and Service Fees
The private corporations embedded inside the consortium generate independent internal profit margins across the different phases of the project lifecycle:
- Upfront Construction Margins: Heavy tier-one commercial builders like ICON Construction capture their financial return upfront by invoicing the consortium for the physical construction and fit-out of the towers using competitive commercial building margins. [1, 12]
- 40-Year Asset Management Fees: Companies like Tetris Capital maintain an active equity stake and act as the master long-term asset managers for the full multi-decade lease duration. They levy fixed, long-term management and administrative fees to oversee the complex financial infrastructure and compliance mapping required by Homes Victoria. [12, 13]
- Property Services Margins: Community Housing Limited (CHL) manages the daily tenancy loop, taking an operational fee out of the incoming rent and Commonwealth Rental Assistance (CRA) payments to fund its staff, localized on-site offices, and basic property management duties. [14]
[1] https://www.housingaustralia.gov.au
[2] https://www.goodfinancialcents.com
[4] https://www.tetriscapital.com
[6] https://www.homes.vic.gov.au
[7] https://www.housingaustralia.gov.au
[8] https://www.tetriscapital.com
[9] https://projectfinancemodeling.com.sg
[10] https://lofotrinvestors.com
[12] https://www.tetriscapital.com
[13] https://www.parliament.vic.gov.au
[14] https://chl.org.au
The Federal Government’s contribution to Ground Lease Model 1 (GLM1) totals $394.1 million [1, 2] .
Delivered through Housing Australia (the Commonwealth’s specialist housing authority), this investment represents the financial backbone that allowed the private consortium to secure low-cost capital and fund the construction of the 1,084 baseline homes. [1, 2, 3]
The federal contribution is cleanly split into two distinct financial mechanisms to target different aspects of the project: [1]
1. Concessional Debt Facility ($344.4 Million)
The vast majority of the federal support—$344.4 million—is issued as a long-term, low-interest loan via the Affordable Housing Bond Aggregator (AHBA). [1]
- The Mechanism: Housing Australia issues social bonds on the international wholesale capital markets backed by an explicit Commonwealth guarantee. Because the federal government carries a AAA credit rating, it can borrow money at incredibly low institutional interest rates. [4, 5, 6, 7]
- The Impact: Housing Australia passes these exact ultra-low interest rates directly to the Building Communities consortium. By stripping out standard commercial bank lending margins, this debt facility significantly reduces the consortium’s ongoing borrowing costs over the multi-decade life of the project.
2. Infrastructure Grant & Loan Blend ($49.8 Million) [8]
The remaining $49.8 million of the federal package is allocated through the National Housing Infrastructure Facility (NHIF). [1]
- The Target: This specific pool of money is restricted to “housing-enabling infrastructure.” Rather than paying for apartment walls, it funded the foundational civil works required to unlock the legacy Crown land footprints. [1]
- The Expenditure: The $49.8 million was spent directly on high-capacity stormwater upgrades, modernised local sewer drainage networks, and bringing heavy gas, water, and electrical substations directly onto the Flemington, Brighton, and Prahran sites. [1]
Macro View: State vs. Federal Split
The overall capital stack to get GLM1 off the ground relied on balancing both tiers of government alongside private operation:
┌────────────────────────────────────────────────────────┐│ VIC State Government: $519 Million (Capital Subsidy) │├────────────────────────────────────────────────────────┤│ FED Government: $344.4 Million (Concessional Debt) │├────────────────────────────────────────────────────────┤│ FED Government: $49.8 Million (Enablement Infra) │└────────────────────────────────────────────────────────┘
By pairing the Victorian State Government’s $519 million direct capital investment with the Federal Government’s $394.1 million financing package, the project successfully leveraged institutional scale without overwhelming either single balance sheet. [1, 2]
[1] https://www.housingaustralia.gov.au
[2] https://ministers.treasury.gov.au
[3] https://www.housingaustralia.gov.au
[4] https://www.housingaustralia.gov.au
[7] https://www.investsmart.com.au
[8] https://www.housingaustralia.gov.au
[9] https://www.premier.vic.gov.au
The total combined government capital and debt allocation across the complete Ground Lease Model 1 (GLM1) portfolio equates to $665,109 per individual dwelling built.
When evaluating these figures, it is crucial to separate the Victorian State Government’s direct taxpayers’ cash expenditure from the Federal Government’s concessional debt injection, which the private consortium must ultimately pay back over the 40-year lease agreement.
The explicit breakdown of public spending per home across the 1,370 total properties (including the core completed estates and active Holland Court expansions) is calculated as follows:
Funding Injections Per Dwelling
| Level of Government [1, 2, 3, 4, 5] | Total Funding Pool | Financial Mechanism | Cost Allocated Per Dwelling |
|---|---|---|---|
| Victorian State Government | $517,000,000 | Direct Capital Subsidy & Infrastructure Grants | $377,372 |
| Federal Government (Housing Australia) | $394,200,000 | Concessional Loans ($344.4M) + Infrastructure Grant ($49.8M) | $287,737 |
| COMBINED GOVERNMENT FOOTPRINT | $911,200,000 | Total Combined Public Exposure | $665,109 |
Nuances Hidden in the Per-Dwelling Math
- The Federal Debt Component: Of the $287,737 federal footprint per apartment, $251,386 is a loan, not a grant. This money must be completely repaid to the Commonwealth by the Building Communities consortium. The consortium funds these repayments using the standard market-rate rents extracted from the 343 Build-to-Rent properties alongside federal Commonwealth Rental Assistance (CRA) payments. [6]
- The True Public Subsidy: Because the private market rentals and affordable housing units are completely self-sustaining via tenant rent, the state’s direct $377,372 per-dwelling cash spend is heavily weighted toward establishing the 619 long-term social community housing placements.
- Built-in 40-Year Maintenance: In a standard government construction project, a $665k per-dwelling price tag only covers the initial build. Under this Public-Private Partnership (PPP) model, this figure represents a “whole-of-life” investment. The private consortium is contractually required to use this capital layout to fully manage and upgrade the buildings out of their own pockets for 40 years, with the state inheriting the complete upgraded portfolio for free at expiry. [7]
[1] https://www.audit.vic.gov.au
[2] https://www.housingaustralia.gov.au
[3] https://www.housingaustralia.gov.au
[7] https://www.audit.vic.gov.au
When comparing the GLM1 public footprint of $665,109 per dwelling against traditional, direct-state-run public housing builds, the figures reveal that the Ground Lease Model carries a higher upfront structural cost, but removes long-term operational debt. [1, 2]
Under a traditional state-run model, the government pays a builder directly to construct high-density housing on public land, then manages it permanently as a public landlord. [3]
Head-to-Head Structural Comparison
| Metric / Feature [4, 5, 6, 7, 8] | GLM1 Public-Private Partnership | Traditional Direct-State Build |
|---|---|---|
| Combined Upfront Cost | $665,109 per individual home | ~$444,000 – $520,000 per home |
| Direct State Cash Output | $377,372 per individual home | 100% of construction costs upfront |
| 40-Year Maintenance Cost | $0 (Absorbed entirely by private consortium) | Compounding debt (Est. $150k+ per unit over 40 yrs) |
| Federal Subsidy Collection | Yes (Unlocks Commonwealth Rental Assistance) | No (Public tenants legally blocked from CRA) |
| Asset Lifespan Goal | Guaranteed 7-star NatHERS handback | Historical pattern of maintenance neglect |
Key Financial Differences
1. The Upfront Cost Premium
Traditional, direct-state-built public apartments in Victoria typically average between $444,000 and $520,000 per unit to build. At $665,109, GLM1 appears significantly more expensive on paper. [4, 5]
- Why GLM1 costs more upfront: A traditional build contract ends the moment the builder hands over the keys. The GLM1 figure is a “whole-of-life” calculation. It incorporates premium 7-star energy design features, higher-quality acoustic soundproofing, extensive communal precinct infrastructure, and a contractually mandated 40-year capital maintenance reserve funded by the consortium. [2, 6, 9, 10]
2. Actual Taxpayer Cash Outflow
While the combined cost of GLM1 is higher, the immediate cash burden on the Victorian Treasury is lower.
- Traditional Build: The state must fund 100% of the building costs directly out of the state budget upfront.
- GLM1 Build: The state only contributed $377,372 in direct cash per unit. The remaining $287,737 was injected as low-cost federal debt via Housing Australia. Because this debt is repaid by the consortium using private market rents and federal subsidies, the state successfully minimized its upfront cash exposure. [10]
3. Long-Term Maintenance and Asset Handback
The true financial divergence happens over the multi-decade life of the asset: [11]
- Traditional Public Housing: The state remains responsible for ongoing upkeep. Historically, this has led to multi-billion-dollar maintenance backlogs, resulting in the eventual decay and demolition of old concrete towers. [12]
- GLM1 Model: The state has zero maintenance liabilities for 40 years. If a lift breaks down or a roof leaks in year 35, the private consortium must pay for it out of their pocket. At the end of the lease, the state inherits the entire 1,370-apartment portfolio in immaculate condition for free. [2]
[2] https://wtpartnership.com.au
[3] https://www.homes.vic.gov.au
[5] https://xirconhomes.com.au
[6] https://www.homes.vic.gov.au
[8] https://www.tandfonline.com
[10] https://www.housingaustralia.gov.au
[11] https://clevertinyhomes.com
Under the Homes Victoria Ground Lease Model (GLM), housing outcomes are achieved by legally binding a private consortium to strict, state-mandated performance targets over a 40-year period. [1, 2]
Because the day-to-day operations are entirely decoupled from traditional public landlord management, the state utilizes a rigid compliance framework to ensure social, physical, and financial tenant outcomes are met.
1. Delivery of Social Outcomes (Tenancy Management)
To protect vulnerable residents and maintain the integrity of the social housing network, the consortium must operate under strict regulatory constraints:
- Unified Waitlist Allocation: The community housing provider, Community Housing Limited (CHL), cannot pick or choose its tenants. It is contractually and legally required to source 100% of its social tier residents straight from the existing Victorian Housing Register (VHR) waitlist, matching applicants based on immediate vulnerability and chronological waiting time. [3]
- Legal Rental Protections: Rents within the social allocations are locked in at a maximum of 25% to 30% of the household’s total gross income (including Commonwealth Rental Assistance), directly mirroring standard public housing rules. If a tenant’s income drops, their rent drops dynamically. [4, 5]
- Enforceable Tenancy Support: CHL operates specialized, 24/7 on-site neighborhood offices across the GLM sites. They are contractually obligated to deliver integrated support services, partnering with local health, mental wellness, and domestic violence agencies to actively prevent evictions and sustain tenancies.
2. Physical and Environmental Outcomes (Asset Management)
The physical quality of the living environment is managed via a strict Key Performance Indicator (KPI) and Service Payment framework:
- The “Tenure-Blind” Mandate: To eliminate social stigma, the consortium must build all units identically. There are no visual or material differences between a market-rate Build-to-Rent luxury apartment and a community social housing placement. They use the same entry lobbies, lifts, and high-end communal amenities. [6, 7]
- Energy Efficiency Targets: All buildings are constructed to a strict 7-star to 8.2-star NatHERS energy rating. This structural layout is intentionally designed to permanently lower utility and thermal-comfort costs for low-income residents, shielding them from energy poverty.
- Financial Penalties for Poor Upkeep: Under the Availability-Payment Public-Private Partnership (PPP) contract, the state government can actively reduce its monthly payments to the consortium if properties are not maintained. If a lift stays broken, a common area is neglected, or a repair takes longer than the contractually specified timeline (e.g., 24 hours for urgent issues), the private partners face immediate financial penalties. [8]
3. Structural Reversion Outcomes (The 40-Year Handback)
The long-term public benefit is secured through the legal definition of the Ground Lease contract:
- Asset Condition Tracking: Throughout the multi-decade agreement, Homes Victoria conducts independent, rolling physical audits of the estates.
- The Expiry Handover: At Year 40, the lease dissolves completely. Because the private partners are contractually required to return the buildings in top-tier operational condition, the state takes full possession of a multi-billion-dollar portfolio of completely modernized, debt-free, high-density public housing stock.
[3] https://www.randwick.nsw.gov.au
[4] https://www.monash.vic.gov.au
[5] https://www.mindaustralia.org.au
[6] https://argylehousing.com.au
[7] https://www.geelongcity.vic.gov.au
While the Ground Lease Model (GLM) is framed by Homes Victoria as a major success for funding modernization without selling public land, it faces intense criticism. Housing academics, tenant advocacy groups like the Save Public Housing Collective (SPHC), and the Victorian Greens have raised significant concerns. [1, 2, 3]
The primary criticisms leveled against the Ground Lease Model include:
1. Privatisation by Stealth and Loss of Rights [3, 4]
Critics argue the 40-year lease structure serves as a “stealth privatisation” of a core public service. [5]
- Erosion of Tenant Protections: Moving tenants from direct state management to private community housing providers (like CHL) reduces oversight. Legal advocates point out that community housing tenants do not have the same legislative safeguards, eviction protections, or direct access to the Victorian Ombudsman as traditional public housing tenants. [6]
- Loss of Agency: Community groups argue that vulnerable, culturally diverse high-rise residents feel stripped of their rights and dignity during forced relocation processes. [3]
2. High Upfront Costs vs. Refurbishment Options [7, 8]
Independent architectural and economic studies challenge the financial logic of the “demolish and rebuild” approach underpinning the GLM pipeline. [8, 9]
- The Retrofit Alternative: Independent research by Monash University indicates that retrofitting and modernizing existing concrete towers would save up to 30% in baseline capital costs compared to flattening them. [9]
- A Waste of Public Funds: Parliamentary submissions argue that standard demolition-and-rebuild pathways under the GLM could cost taxpayers billions more over 40 years compared to strategic code-compliance retrofits. [8, 10]
3. Lack of Accountability and “Confidential” Business Cases [11]
The transparency of how these multi-million dollar public-private partnerships (PPPs) are awarded has faced legal and political pushback. [11, 12]
- Secret Cabinet Documents: Homes Victoria has repeatedly refused to release the specific expert financial business cases justifying the GLM over non-profit models, citing Cabinet confidentiality. [11, 12]
- Failed Legal Defences: This lack of transparency sparked a failed Supreme Court class action on behalf of hundreds of displaced public housing households trying to force the release of the state’s decision-making data. [9, 12]
4. Poor Social Outcomes and Mixed-Tenure Friction [13, 14]
Urban planning evaluations of historical mixed-tenure models in Victoria show that placing private market rentals and social housing in the same building does not automatically create social cohesion. [13, 15]
- Superficial Social Mix: Past project reviews found that “social mix” was largely ineffective at stimulating genuine interaction between private and social tenants. [13, 15]
- Hidden Segregation: Despite “tenure-blind” architectural mandates, residents report that private market renters and social housing tenants often end up socially segregated within the micro-communities, while the overarching rental revenues flow directly to private corporate developers rather than being kept for public reinvestment. [13, 15]
5. Flawed Definitions of “Affordable” Housing [16]
The definitions of what constitutes “affordable” within the GLM portfolios have been heavily critiqued by the Victorian Greens. [2, 16]
- Developer-Led Benchmarks: Because the “affordable” tier is pegged to a percentage of the surrounding local market rent (usually capped at 75% to 80%) rather than a household’s actual income, tenants in high-value suburbs face steep rent hikes if local market prices surge. Critics argue the government is allowing private developers to define affordability parameters, making the units out of reach for lower-income workers. [2]
If you are evaluating these criticisms for a policy or research project, let me know:
- Would you like to review the specific tenant lease terms where community housing differs from public housing?
- Do you want to see the specific suburbs currently facing high-rise tower demolitions under the model?
- Are you looking for alternative non-profit models suggested by housing advocates? [9, 11]
[4] https://www.parliament.vic.gov.au
[5] https://www.parliament.vic.gov.au
[6] https://www.parliament.vic.gov.au
[7] https://www.parliament.vic.gov.au
[8] https://www.parliament.vic.gov.au
[9] https://www.theurbandeveloper.com
[10] https://www.parliament.vic.gov.au
[11] https://thefifthestate.com.au
[12] https://www.northwestcitynews.com.au
[15] https://cur.org.au
The Ground Lease Model 1 (GLM1) portfolio delivers a definitive social housing allocation representing 45.2% of the total dwellings built across the package. [1, 2]
While earlier construction projections calculated the ratio against the initial three completed sites, the final figures reflect the integration of the Stage 2 expansion at Holland Court: [1, 3]
The Mathematical Distribution
- Total Social Housing Dwellings: 619 homes (comprising 100% Community Housing slots, with zero units retained as traditional public housing).
- Total Consolidated Portfolio Footprint: 1,369 homes across all four targeted locations.
- The Result: 45.2% of the physical buildings are dedicated exclusively to social housing register placements. [1, 2, 4, 5]
Step-by-Step Portfolio Breakdown
The total percentage is achieved by shifting the concentration of social vs. affordable tenancies depending on the density of the individual site: [2]
[GLM1 Complete 2026 Portfolio Split] ├── Social Housing (Community Tier) ─── 45.2% (619 Dwellings) ├── Capped Affordable Housing ───────── 20.4% (279 Dwellings) └── Private Market Build-to-Rent ────── 34.4% (471 Dwellings)
- Bangs Street, Prahran: Out of 434 total homes, 228 are allocated to the social housing registry (52.5%).
- New Street, Brighton: Out of 291 total homes, 151 are allocated to the social housing registry (51.9%).
- Victoria Street, Flemington (Stage 1): Out of 358 total homes, 240 are allocated to the social housing registry (67.0%).
- Holland Court, Flemington (Stage 2 Expansion): Out of 286 total homes, 50 are allocated to the social housing registry (17.5%). [1, 3, 4, 6]
Policy Context for this Result
This 45.2% outcome highlights a deliberate structural compromise compared to Victoria’s legacy public housing estates: [7]
- The Mixed-Tenure Offset: Traditional public housing estates were historically comprised of 100% public renters. To fund the modernization of these decaying sites without relying entirely on direct taxpayer cash, Homes Victoria introduced a cross-subsidization model. [7]
- The Resulting Mix: By dedicating roughly 54.8% of the new structures to market-rate Build-to-Rent (34.4%) and capped affordable essential worker housing (20.4%), the private consortium generates the long-term rental revenue needed to repay its infrastructure bonds—leaving a permanent, self-sustaining 45.2% chunk of the portfolio locked in for Victoria’s most vulnerable waitlist applicants. [1]
[1] https://www.housingaustralia.gov.au
[3] https://www.tetriscapital.com
[5] https://www.premier.vic.gov.au
[6] https://www.theurbandeveloper.com
[7] https://www.tandfonline.com
[8] https://www.premier.vic.gov.au
The total net change across the Ground Lease Model 1 (GLM1) footprint represents a net increase of 174 social housing dwellings. [1]
While the total volume of keys handed over is significantly larger, this net figure reflects the physical removal of older, dilapidated mid-century public walk-ups to make way for the new mixed-tenure estates. [1, 2]
The Before and After Calculation
- Dwellings Demolished (Before): 445 legacy public housing units across the Prahran, Brighton, and Flemington sites were permanently decommissioned and demolished. [1, 2, 3]
- Social Dwellings Constructed (After): 619 new community housing units were built and integrated into the modern developments. [1, 4]
- The Net Social Lift: +174 additional social housing slots, representing an approximate 39% net expansion in the sites’ capacity to house applicants from the Victorian Housing Register.
The Total Density Transformation
The relatively modest net increase in social housing units is a byproduct of the mixed-tenure framework. To fund the replacement of the original 445 dilapidated structures without relying entirely on direct state handouts, Homes Victoria used the remaining land density to add entirely new housing types: [1, 5]
[GLM1 Total Footprint Transformation]Legacy Sites: [ 445 Public Housing Units ] (Demolished) │ ▼Modern Estates: [ 619 Social Units ] + [ 279 Affordable Units ] + [ 471 Market BTR Units ]
By expanding the overall site capacity from 445 to 1,369 total dwellings, the project generated 924 entirely new homes for the inner-Melbourne rental market. [1]
Why the Net Social Figure is a Focal Point of Critique
This net result of +174 social homes forms the foundation of political and community backlash against the model: [6, 7]
- Missed Opportunity for Vulnerable Tenants: Housing advocates and the Victorian Greens argue that when the state government initiates a multi-million-dollar demolition program on Crown land, it should maximize the volume of social units. They view a net gain of just 174 units out of 1,369 new builds as an inefficient use of public land. [1, 6, 7]
- Bedroom-Capacity vs. Unit-Capacity: Critics note that while the physical unit count grew by 174, the layout of modern configurations skews heavily toward single-bedroom and two-bedroom apartments to mirror modern density demands. As a result, the net shift in actual bed spaces for larger families on the housing waitlist is much tighter than the unit volume implies.
[2] https://www.parliament.vic.gov.au
[4] https://www.tandfonline.com
[7] https://www.parliament.vic.gov.au
[8] https://www.parliament.vic.gov.au


Leave a Reply